Statistical Research for Behavioral Sciences
Brian G. Smith, Ph.D.
Lesson 4 - Frequency Distibution, Percentile Ranks, Graphing
You may also check your understanding of the material on the Wadsworth web site. Click on the Publisher Help Site button.
![]()
Homework - Lesson 4
Any student may may do the assignments from any area. You may run through this work an unlimited number of times. If you make errors, you will be referred to the appropriate area of the book for re-study.
.
Assessment - Lesson 4
You will have two options to take the quiz. If you fail to achieve 100% on the quiz, you will not able to advance to the next lesson. After failing on the second take, please email the instructor at ed602@mnstate.edu so remedial action can be taken.
| Homework and Quizzes are on Desire 2 Learn. Click on the Desire 2 Learn link, log in, select the Homework/Quizzes icon and choose the appropriate homework or quiz. |
![]()
Assignment and Information
Reading:
Chapter 2
|
Definition Page: Contains definitions arranged alphabetically. |
Notes Describing data
Shapes of frequency distributions
Now we can use this information to look at our BASC data. |
||
1. These are the scores you collected for the Hispanic students in your BASC study:
|
||
|
|
|
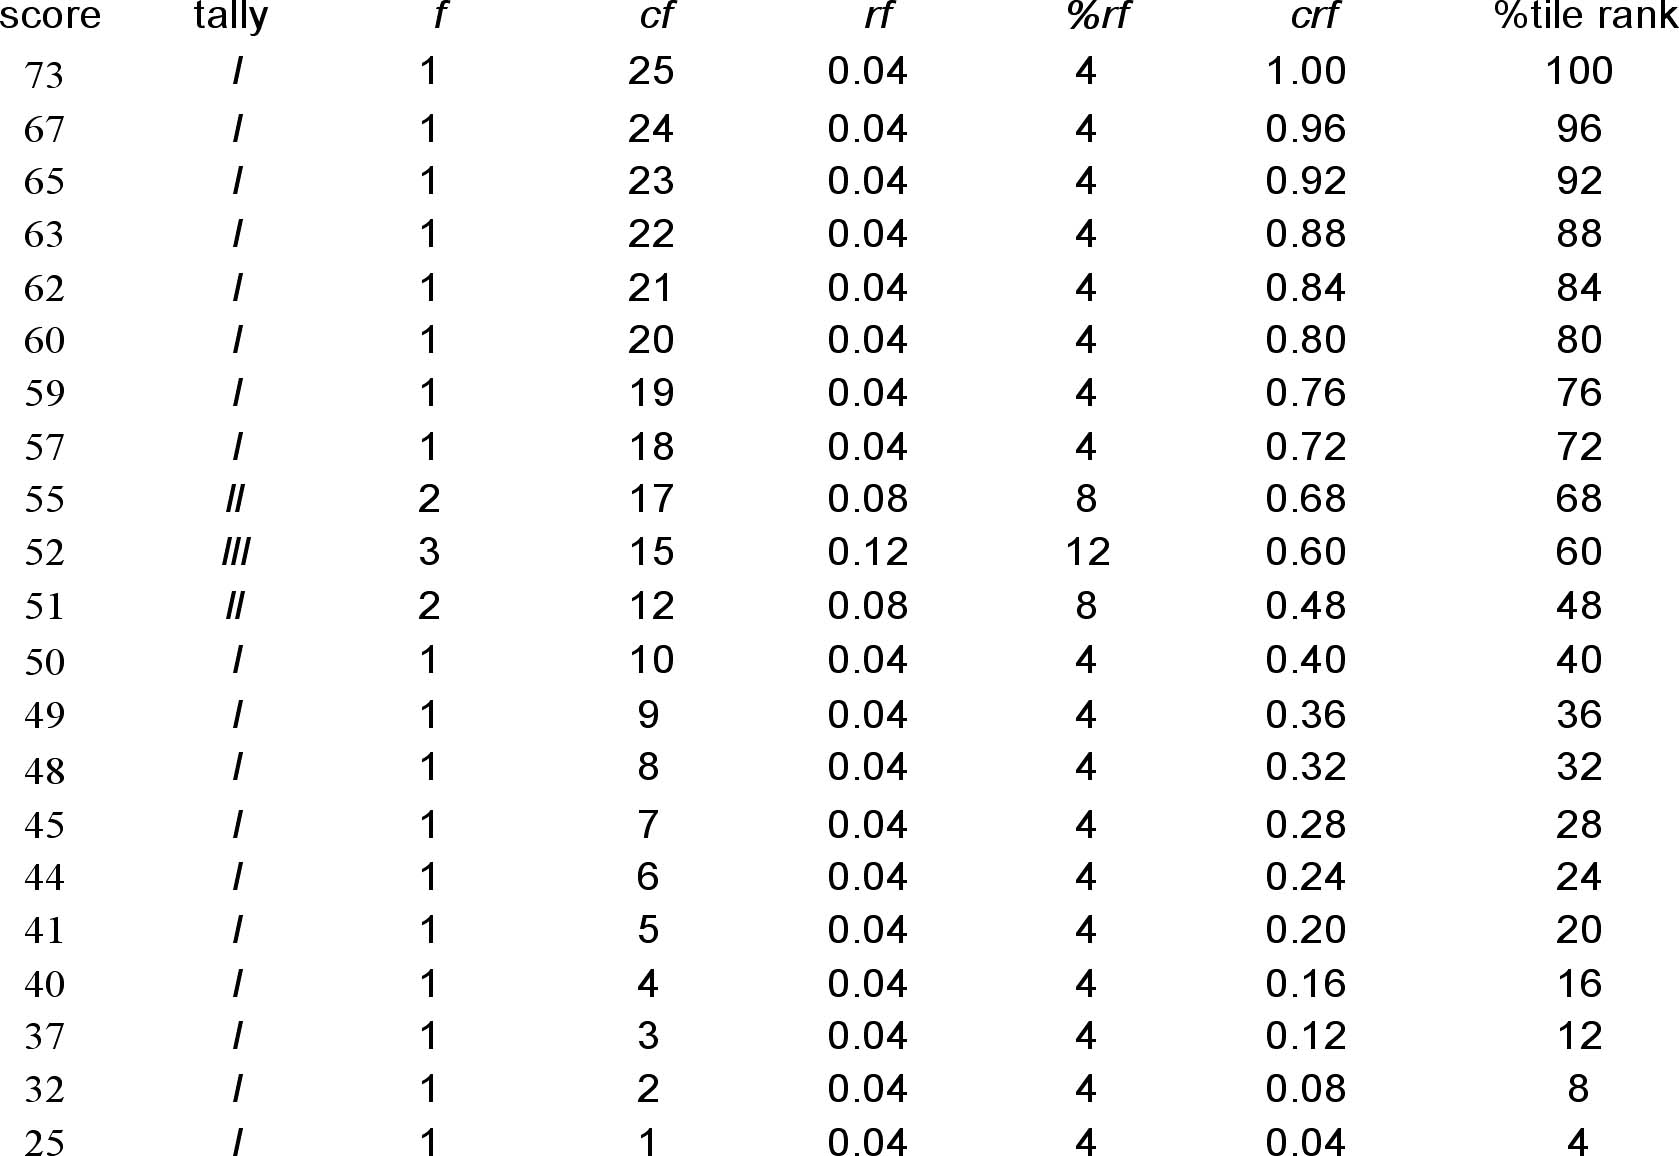
| 2. An ungrouped distribution would look like this: | ||
 |
||
| 3. A grouped distribution might look like this: | ||
|
||
| 4. A grouped frequency histogram would look like this. | ||
 |
||
SPSS Tips:
|
||
Vocabulary
Raw data - The scores of a subject exactly as collected and before they are analyzed statistically.
Frequency distributions - A table showing each score in a set of scores and the number of times it occurred
-
simple ungrouped frequency ( f ) - Listing each possible score value and then placing a tally mark next to each score for each time it occurs in a set of scores results
-
relative ungrouped frequency ( rf ) - Dividing the frequency of a score by the total number of scores in the distribution of scores
-
percent ungrouped frequency ( % f ) - the relative frequency ( rf ) scores multiplied by one hundred.
-
simple grouped - Listing each possible class interval and then placing a tally mark next to the interval for each time a score in that interval appears in the set of results.
-
relative grouped - Dividing the frequency of scores in an interval by the total number of scores in a grouped frequency distribution
-
percent grouped - the grouped relative frequency multiplied by 100
Class interval - the range of score values into which the raw scores are grouped in a grouped frequency distribution.
Cumulative frequency of a score -( cf ) - the frequency of occurrence of a score plus the sum of the frequencies of all the scores of lower value.
Percentiles - a score at or below which a specified percentage of the scores ina distribution fall
Percentile rank - the percentage of scores in a distribution that are equal to or less than that score
Histograms - a bar graph in which size of the class interval is represented by the width of the bar on the abscissa (x axis). and the frequency of scores in the class interval is given by the height of the bar.
Frequency polygons - Connected dots indicating the frequency at the midpoints of classintervals with straight lines
Stem and leaf display - A display of data in which the first digit of a score is the stem, and the last digit is the leaf.
Bar graph - a graph used to present a frequency distribution for qualitative data
Symmetrical frequency distribution - A distribution in which one side is the mirror image of the other side
Skewed - when a distribution has scores clustered more at one end than at the other
Mode - the most frequently occurring score in a distribution
-
Unimodal distribution - a distribution with only one peak
-
Bimodal distribution - a distribution with two peaks
-
Multi-modal distribution - a distribution with three or more peaks
-
The normal distribution - a symmetrical and bell-shaped distribution


