Subtotals in Excel
Excel has a built-in process to group data together by
a related field, and determine an average, count, subtotal, or other
mathematical functions for the sub-group. You'll find it under the "Data"
menu, labeled "Subtotal"
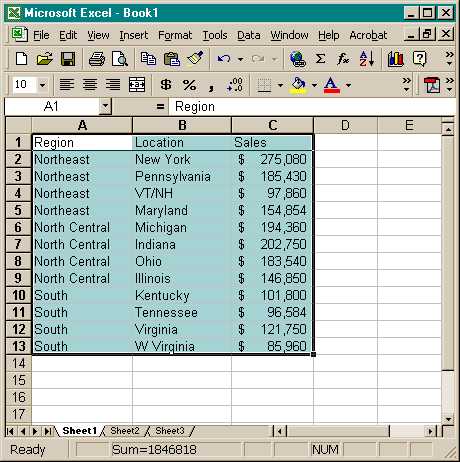
The figure below shows a set of data for sales by market
area. Note that the entire range, including the labels in the first
row, has been selected:
Select the "Data menu item, then "Subtotals".
This dialog box appears:
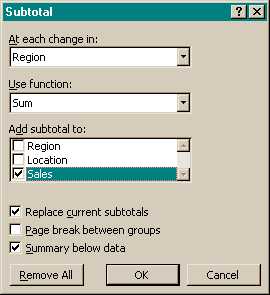
Note that you can determine whichitem to group by - in this
case the data will be grouped together by Region. You also can decide
whether to display subtotals for other fields, whether each group should
appear on its own page for printing, and whether to add a grand total
at the bottom. Clicking "OK" changes the view to this:

Clicking the [-] button for a group collapses it so that
only the subtotal shows. In many cases, such as summary report for supervisors,
this collapsed view is more readable, but the detail can be seen by clicking
the [+] for the group:

You can remove the subtotals by selecting that button on
the subtotal dialog box. You can also choose a different function than
sum. Selecting "Average" as shown:
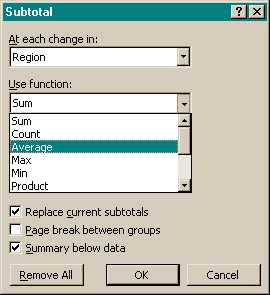
will produce a new set of totals showing the average sale
for each region, and the overall average of sales. Note that you can also
count the number of items, determine the largest or smallest item, and
more.
|