Correlational
Research
Strategy
A.
Relationships
No attempt to manipulate or control variables
Measuring 2 or more variables as they exist naturally
Goal: Establish that a relationship exists between the variables & describe the nature of that relationship

Pearson’s product-moment
correlation coefficient (r): -1 to 0 to +1 (direction & magnitude)
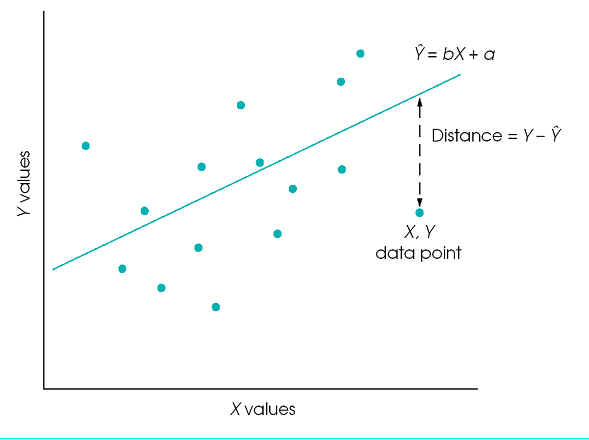
scatterplots: graphical displays of the relationship between two variables

B.
Predictions
Using regression analysis, we can predict values on y, given values on x


C. Interpreting Correlational Research
Caution:
Correlation does not imply causation. Why not?
Because the following 2 problems exist in correlational research:
(1) Third-variable
problem
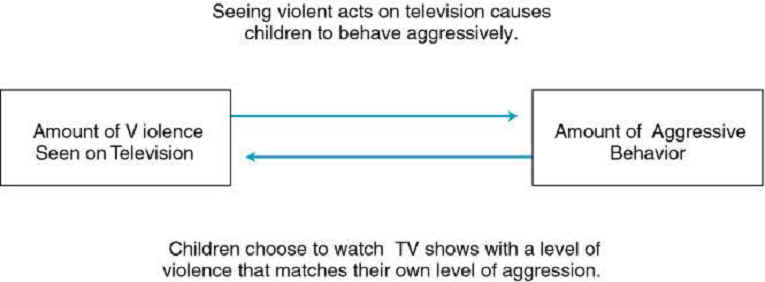
(2) The directionality problem
Argument: The more golf the members of a country play, the more peaceful the nation is. Therefore, playing golf causes peace. Do you accept this conclusion?
The Third-Variable Problem

The Directionality Problem
