Intro. to t-Statistic
and the Single Sample t-Test
I. Introduction
Conceptually, t = observed difference between the two means / difference expected by chance
A. The t-statistic is a substitute for z (z is same as t except z requires more information about the population. We rarely have much information about the population, so we end up using t much more often than z.
- to use z, you must know- s (the population standard deviation)
- what do you do if you don't know s ?
- t
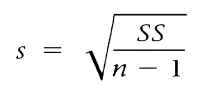
statistic allows you to use sample standard deviation - s - instead of s
Remember that
S2 = SS/n - 1
SO

Remember:
![]()
- then use estimated standard error for a sample - S xbar or SM

- use a t statistic instead of a z statistic (very similar formula)
t
= M-µ/ SM
where
 or
or

- Rule - if you know the population standard deviation, use z. If you do NOT know the population standard deviation, use t.
B. Degrees of Freedom
- df = n - 1
- the greater n is, the more closely S represents s, and then the better t represents z
C.
t distribution

- generally not normal - flattened and stretched out
- approximates normal in the way that t approximates z
- shape determined by df
- Table B.2 shows critical values for the t-statistic is on p. 703


II. Hypothesis Testing with t statistic--Single Sample t-test
A. Formula
t
= M-µ/ SM
where
 or
or

B.
Steps (just like z)


n = 16 birds, µ = ?, s = ? We need to estimate µ and s.
M = 39 minutes on the plain side and SS = 540
Do birds spend equal amounts of time in the plain chamber and the chamber with eyespots? Use a 2-tailed test and set alpha at .05.
1) State the hypotheses.
2) Locate the critical region of the t-distribution
3) Calculate the t-statistic
4) Make a
decision regarding the null and alternative hypotheses.