Psychology 231
Stats/Methods I
Percentiles,
Percentile Ranks, and Interpolation (GW 2)
I. Percentiles and Percentile Ranks
Percentile Rank - the percentage of individuals in the distribution with scores at or below the particular value.
Percentile - the particular score (X) associated with a percentile rank.
E.g., You scored X=4 on the test (see the distribution below). You know that roughly 85% of the class had scores of 4 or lower.
Your score has a percentile rank of ____.
Your score of ____ would be called the 85th percentile.
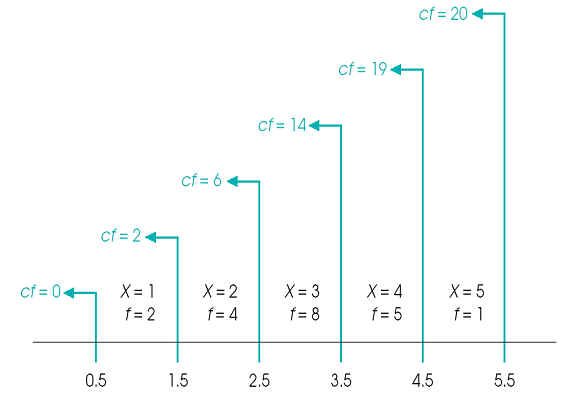
Cumulative
frequencies (cf) show the number of individuals located at or below each score
To find percentiles, we must convert these frequencies into percentages.
-
The percentages that result are called cumulative percentages (c%)--show
the percentage of individuals accumulated as you move up the scale
X f p
% cf c%
5 3 .15 15%
20 100%
4 4 .20 20%
17 85%
3 8 .40 40%
13 65%
2 3 .15 15%
5 25%
1 2 .10 10%
2 10%
Now consider example 2.5 on p. 53
Remember that the X values in the table are not points on a scale, but intervals
Each cumulative percentage value is associated with the upper real limit of its interval
II. Interpolation
A Graphic Representation of Interpolation
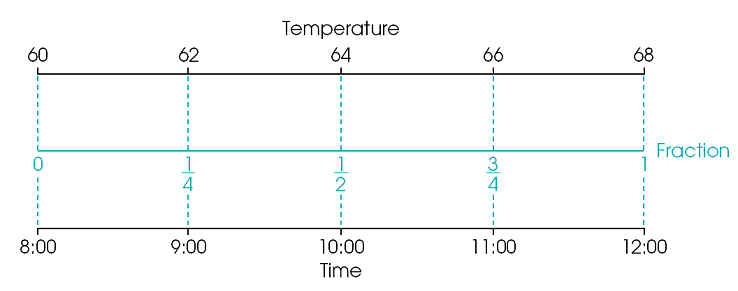
4 Steps for Interpolation
Find the width of the interval on both scales
Locate the
position of the intermediate value in the interval. What fraction of the
whole interval?
fraction = distance from top of interval/interval width
Use fraction
to determine the distance from the top of the interval for the other scale
distance = fraction x width
Use distance from top to determine the position on the other scale