Psy 230 Hypothesis Testing
I. Logic of Hypothesis Testing
A. Hypothesis Testing
- an inferential procedure that uses sample data to evaluate a hypothesis about a population
- general scheme
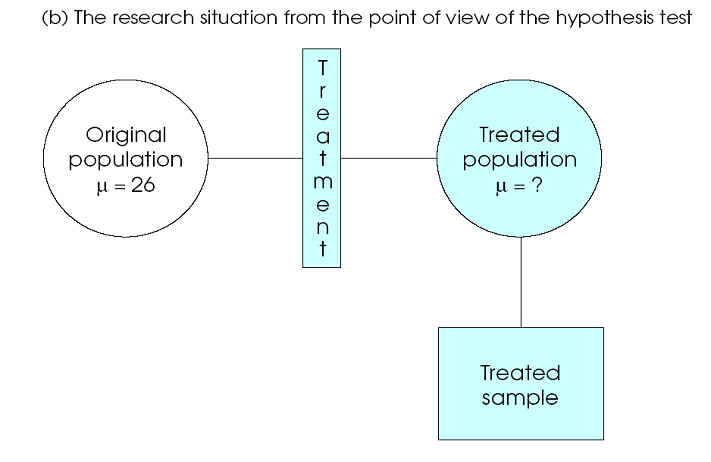
1. State hypothesis about population
2. obtain random sample
3. compare (M - m)
- assumption: if treatment has effect it adds a constant to each score
n=16
B. Procedure
1. State Hypothesis
Ho = null hypothesis, treatment has no effect
H1 = treatment has effect (alternative or experimental hypothesis)
2. Set criteria for decision
- there is always some discrepancy between sample stats and pop. parameters
- sampling error

3. Collect sample data
4. Evaluate Null hypothesis
Reject Ho
Retain Ho (Fail to reject Ho)
C. Errors in Hypothesis Testing
1. Type I error - reject Ho when true
2. Type II error - fail to reject Ho when false

II. Evaluating Hypotheses
A. Alpha Level (a)
- minimize risk of type I error
1. determine what data are expected if Ho true
2. determine what data are unlikely if Ho true
3. use distribution of sample means separated into two parts
- M expected (hi prob) if Ho true
- M unlikely (low prob) if Ho true
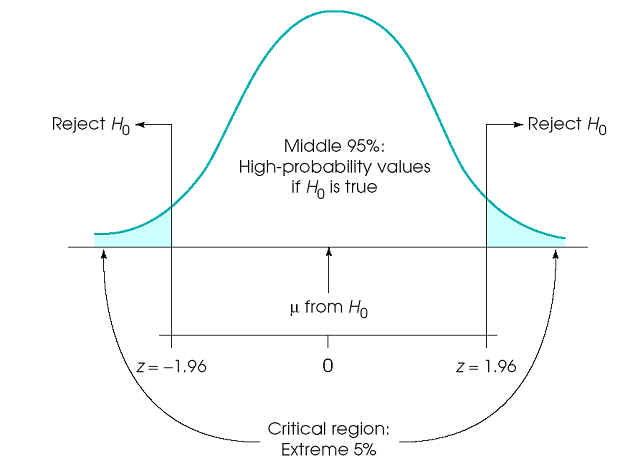
4. alpha level defines very unlikely (e.g., extreme 5% of distribution) scores to obtain by chance
- M compatible with middle of distribution
- M compatible with extremes of distribution
5. When Ho falls into tails, we reject Ho
- very unlikely sample if the treatment had no effect
B. z scores in Hypothesis Testing
z = obtained difference / difference due to chance
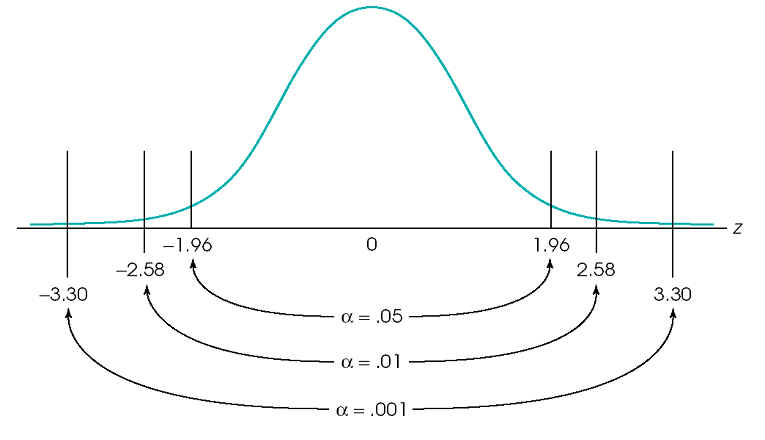
C. More about Alpha levels
a = 0.05, critical region +/- 1.96
a = 0.01, critical region +/- 2.58
a = 0.001, critical region +/- 3.30
D. Assumptions
1. random sampling
2. independent observations
3. homogeneity of variance, s not changed by treatment
4. normal sampling distribution (sample size, population distribution)
III. Directional (one-tailed) tests
A. Critical region in only one tail
a = 0.05, critical region 1.64
a = 0.01, critical region - look up
a = 0.005, critical region - look up
a = 0.001, critical region - look up
- reject Ho with smaller difference between M and m
- more "sensitive"
- increase the possibility of Type I error (false alarm)
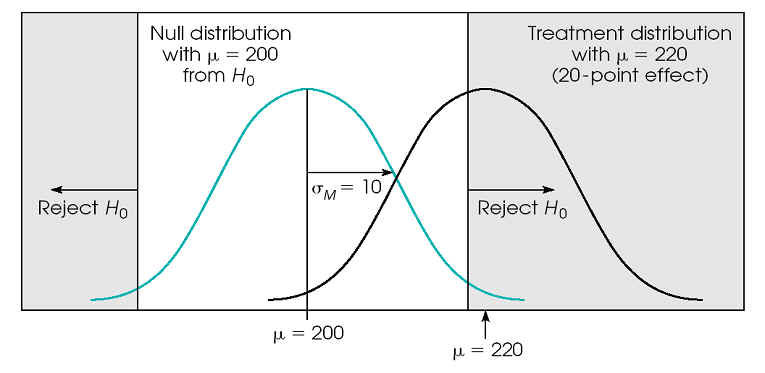
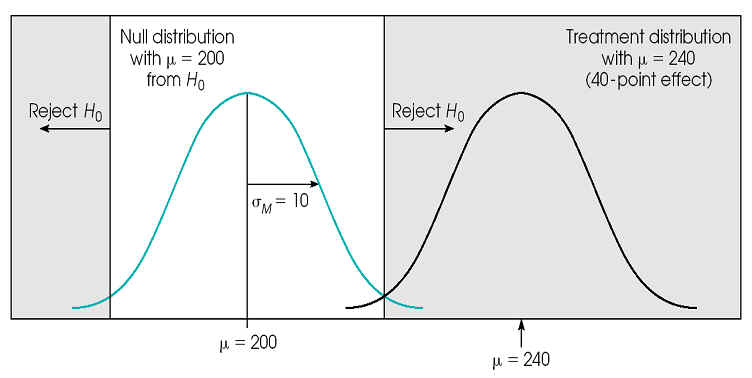
B. Power
- the probability of detecting a treatment effect when one is indeed present.
-
power is the opposite of Type II error (when a treatment effect really exists in
the population).
-power
= 1 – (type II error) or 1 – (beta)
-as
type II error decreases, power increases
- by decreasing type I error (move from .05 to .01) we directly increase type II error (and thereby decrease power).
The Relationship between Power and Sample Size

The Relationship between Power and Effect Size