Psy
232 - Stats/Methods I
The
independent sample t-test
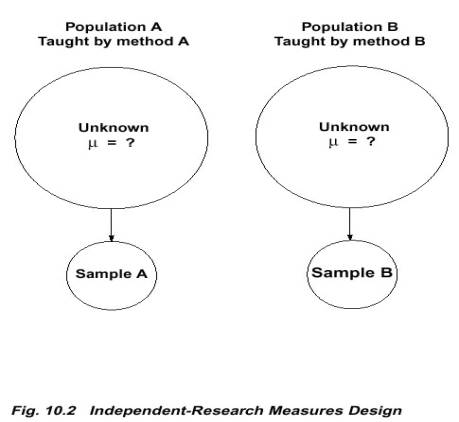
I. Independent
Samples
A.
Two Sources of Variability (error)
-
each of the two samples will have some error as Xbar represents m
-
would be nice to simply add and then average the "s Xbar" from each sample
-
can't (unless samples are the same size)
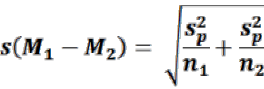
-
Pooled Variance
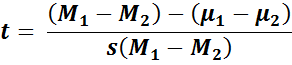
B.
The formula
C.
Degrees of Freedom
df
= df1 + df2
=
(n1 - 1) + (n2 - 1)
D.
Assumptions
1.
observations in each sample are independent
2.
underlying populations are normal
II. Single Sample vs. Two Independent Samples

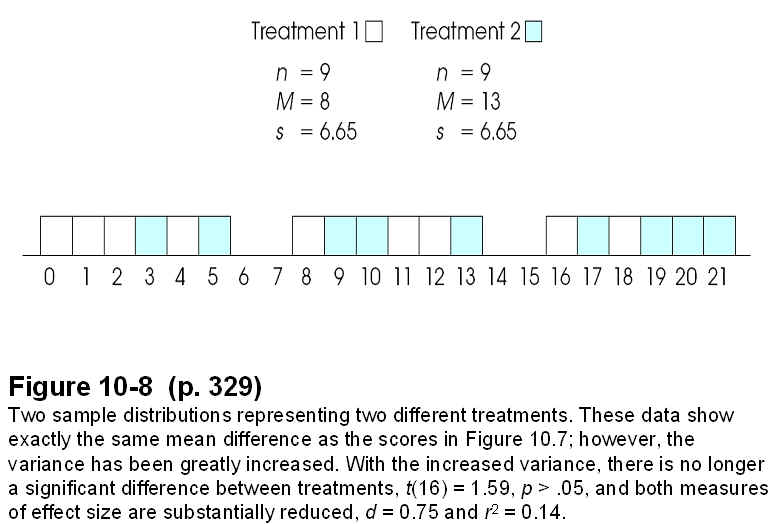
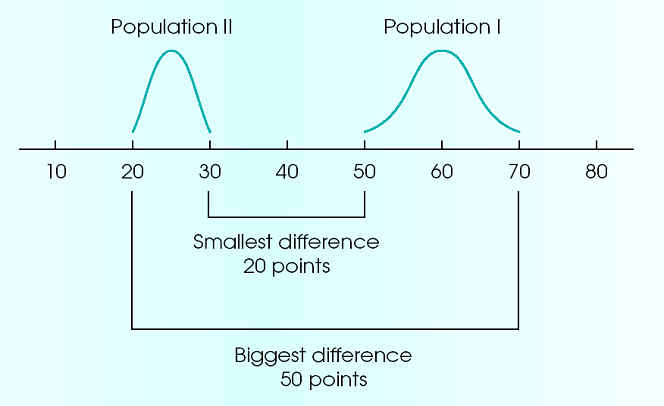
III. Variability and Effect Size