 ,
, ,
, and even more‼! This is a sale you cannot miss‼!
Fractions, Number Lines, and Order
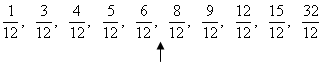
What is wrong with the following sample advertisement statement?
For one day only, save,, and even more‼! This is a sale you cannot miss‼!
Each fraction value is less than the previous value,  , but the ending "and even more" implies that each fraction value is becoming greater in value. The statement is a common mistake that many people make when using fractions. Here, the order of the fractions in the statement is based on the value of the denominator and not on the true value of the fraction. The statement should be, For one day only, save
  ,
, ,
, and even more‼! since the advertisement is implying that on some items a person can save more than half the listed price.
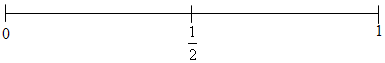
We use a number line model to illustrate fraction order for values between 0 and 1. We divide that length into two equal-sized pieces and label the point where the segment is divided with the coordinate  . The distance from 0 to
  represents a length of one-half the whole segment from 0 to 1.
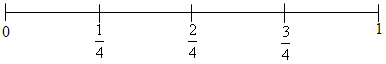
We further divide each of those halves in half; the points where each segment is divided are represented by the fractions  and
and  . As with equivalent fractions from the previous session, we may label the point at
  as
as  , that is, this is another way to visualize equivalent fractions.
The next diagrams illustrate an extension of fraction order relationships to twelfths, sixths, fourths, thirds, and halves, and how they relate to each other on the segment between 0 and 1.

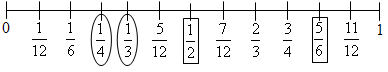
We bring these number lines together in the illustration below to a single number line with the coordinates labeled with the simplified form for each of the fractions in the above illustration.

When we compare values, the one that is farthest to the left on the number line has the least value. Looking at the diagram below, we see that  (circled values). Likewise, we see that
  (boxed values).
If we did not refer to a completed number line, we could still determine these inequalities by changing each pair of fractions to fractions with common denominators.
Examples:
Since  ,
,  , and
, and  , we have
  . Twelfths is a common denominator for fourths and thirds.
Since  and
and  , we have
  . Sixths is a common denominator for halves and sixths.
Further note that we could have compared all four of the fractions  ,
,  ,
,  , and
, and  by changing them all to the common denominator of twelfths. Since
  , we have
  . By converting the fractional values to fractions with common denominators, we are able to easily compare their relative sizes.

Notice that the least common denominator is the least common multiple (LCM) of 2, 3, 4, and 6. The value of the LCM(2, 3, 4, 6) is 12 as illustrated below with the set intersection method for finding the least common multiple.

Reminder: we can also find the least common multiple (LCM) by prime factorization into the exponential form.
|
2 = 2 |
Taking the largest exponent of each prime factor we get
22 · 3 = 4 · 3 = 12. So, LCM(2, 3, 4, 6) = 12.
|

Five students brought identical sized pans of bars to sell in a bake sale. The bars were all cut to be the same size. By the end of the sale, three-fourths of Cary's bars, two-thirds of Dana's bars, half of Jamie's bars, five-eighths of Lynn's bars, and seven-eighths of Terry's bars were sold. Whose pan of bars was the median amount sold?
The median of a set of fractions can be found by using the same method that we used for a set of whole numbers. Remember that the median is found by first ordering the set of values, and that a good method for ordering fractional values is to rewrite them with a common denominator.
Solution for the above problem: We first find the least common denominator by finding the least common multiple for 4, 3, 2, 6, and 8. We find the LCM by the prime factorization method.

Next, place the fractions in order from least to greatest.
The median value is the 3rd value of  . We take the simplest form, so the median is
  .
.
We have found that Cary sold the median number of bars.
Example: Find the median of this list: 
Solution: First we need to order these values from least to greatest. There are many ways to do this. We could use a number line like the one on the previous page. Here, we will change all of these values to a common denominator:

Now we place these in order from least to greatest and select the median.
Since there are 10 values in the list, we need to find the value that is halfway between the 5th and 6th values. So, the median is  .
.
We may use bar diagrams to help solve some types of problems. For example, use a bar diagram to solve the following problem:
Missy had $45. She spent of her money on a book. How much money does she have left?
Solution: The answer to the question, "What is  of $45?" gives us the amount she spent. The amount she has left would be the amount left after the amount she spent is removed.

We have that 1 unit is $9. So, 2 units would be $18 and 3 units would be $27.
Missy has $27 left after spending $18 of her $45.
One way of estimating solutions to problems involving fractions is to use 0,  , and 1 as key points or anchors to help us visualize the relative size of fractions between 0 and 1. These are good reference points or landmarks to keep in mind when estimating solutions.
Example: Is  closer to 0,
  , or 1?
Solution: First we notice that  is equivalent to one-half, so
  is greater in value than
  . Next we notice that the numerator 5, is as close as we can get to the denominator 6, without reaching
  . So we conclude that
  is closer to one.
Example: Is  closer to 0,
  , or 1?
Solution: First we notice that  is equivalent to
  . We conclude that
  is slightly larger than one-half.
Example: Estimate the value of the sum for  .
.
Solution: We estimate the value of the sum to be 3, since  .
.
Note that the symbol, ≈, means approximately equal to. The symbol should be used anytime an estimate or approximation is made during a computation.
Order is Heaven's first law.
An Essay on Man IV - Pope, Alexander (1688-1744)