Statistical Research for Behavioral Sciences
Brian G. Smith, Ph.D.
Lesson 5 - Measures of Central Tendency
You may also check your understanding of the material on the Wadsworth web site. Click on the Publisher Help Site button.
![]()
Homework - Lesson 5
Any student may may do the assignments from any area. You may run through this work an unlimited number of times. If you make errors, you will be referred to the appropriate area of the book for re-study.
.
Assessment - Lesson 5
You will have two options to take the quiz. If you fail to achieve 100% on the quiz, you will not able to advance to the next lesson. After failing on the second take, please email the instructor at ed602@mnstate.edu so remedial action can be taken.
| Homework and Quizzes are on Desire 2 Learn. Click on the Desire 2 Learn link, log in, select the Homework/Quizzes icon and choose the appropriate homework or quiz. |
![]()
Assignment and Information
Reading:
Chapter 3
|
Definition Page: Contains definitions arranged alphabetically. |
Notes:
|
 |
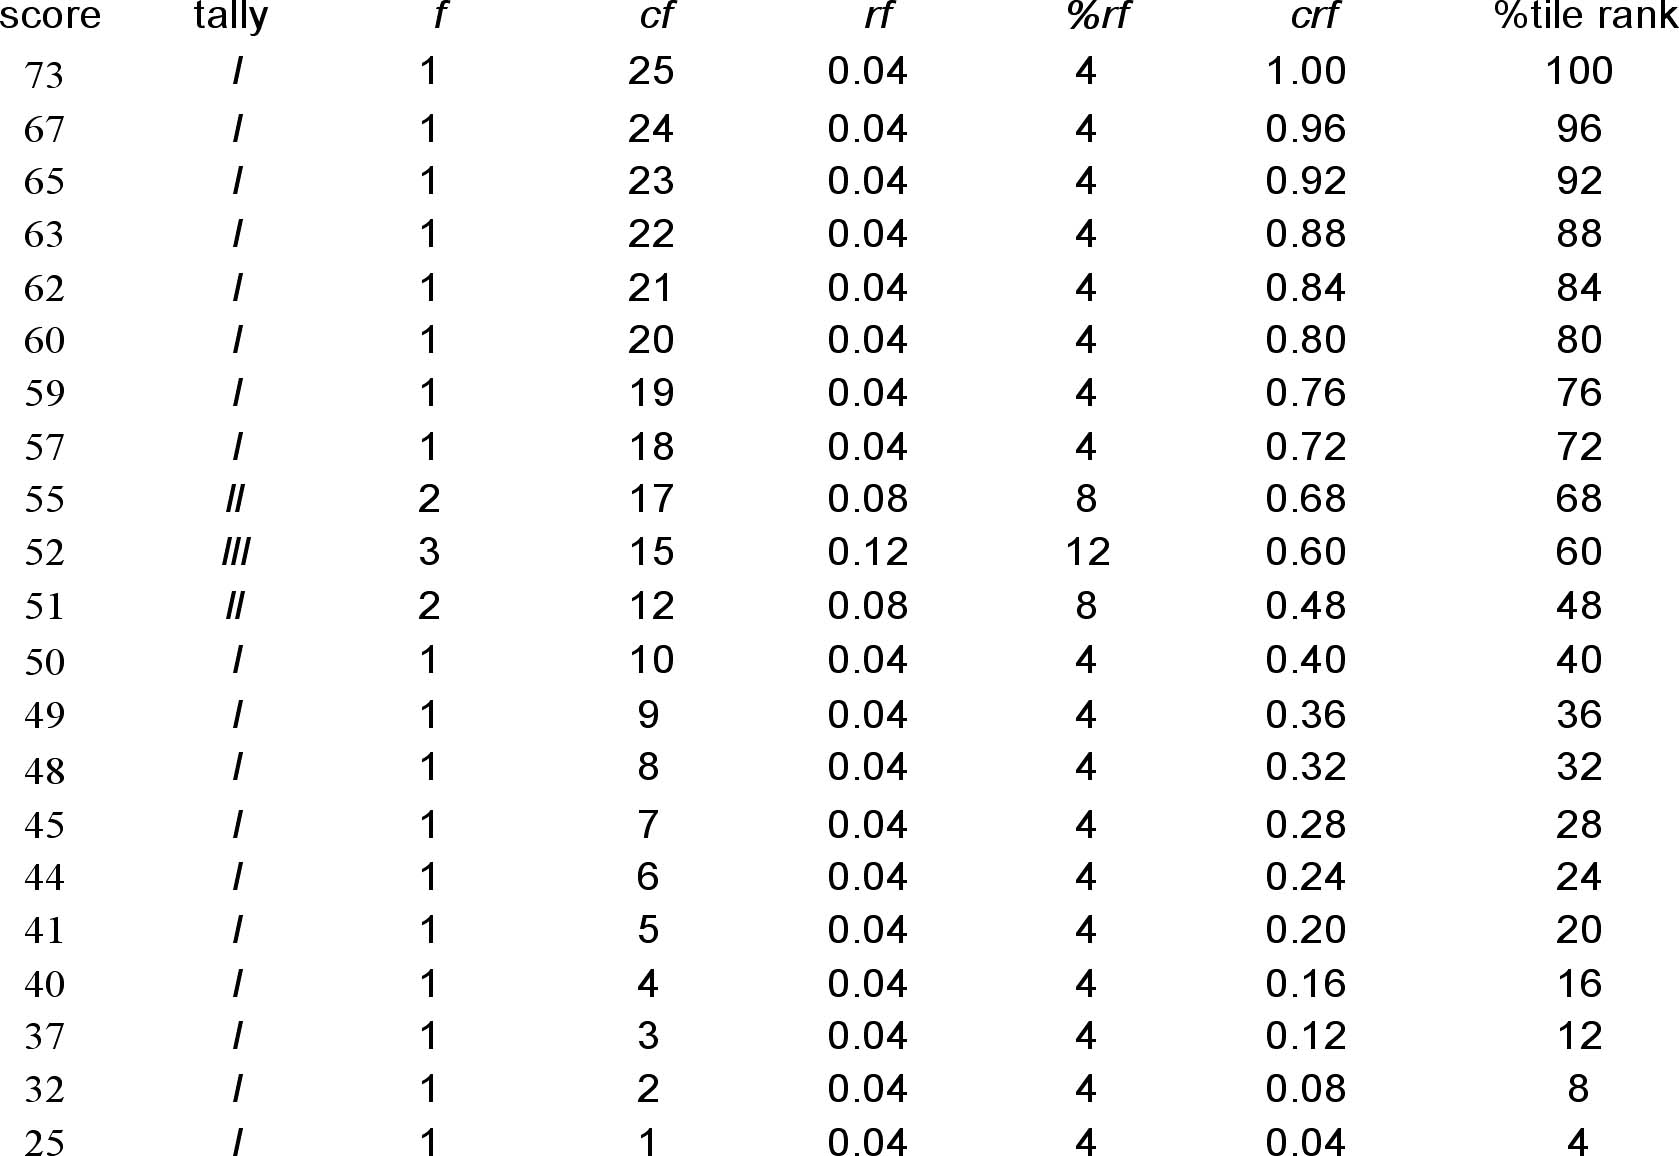
| Okay, now that we have collected all our BASC data, we need a way of sharing that data with the public in a way that makes sense. While frequency distributions like this one are nice, they are often too bulky for most journal publications, and they donÍt allow for easy comparisons between groups. Measures of central tendency come in handy, because they allow you to sum up an entire table of data into one score. This is an average or typical score for the group. |
Mode - the most frequently occurring score in your data - For
our BASC data 52 occurs the most often, three times.
|
Median - The score in the middle, when scores are ordered numerically - for our BASC data we have 25 scores, so the half way point is the 13th score. Counting down from the top, the 13th score is 52
|
| The text gives a formula for calculating the median for data that has tied scores around the median. This formula is often used in statistical software because it can be significant that a score is the first or 6th score in a set of tied scores (it helps in pointing out slight skew for example). It is helpful to understand this formula, but for homework purposes, our data is small enough that counting out the median score by hand is easier, and the score will make more sense to the common reader. If you want to try and calculate the median with the percentile formula for practice, you should get a median BASC score of 51.67 which reflects the fact that our median score is the first of the 3 tied scores. |
Sample
Mean or Mean (
|
 |
| Power in statistics is the ability to detect differences between groups when there actually is a difference between groups. Because the mean uses every score in the data set, it is the most statistically powerful of the three measures. Unless you have a good reason to use mode or median, like bimodal distributions or heavily skewed data, the best measure to use is the mean. |
SPSS Tips:
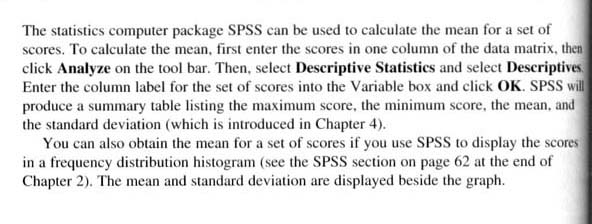
|
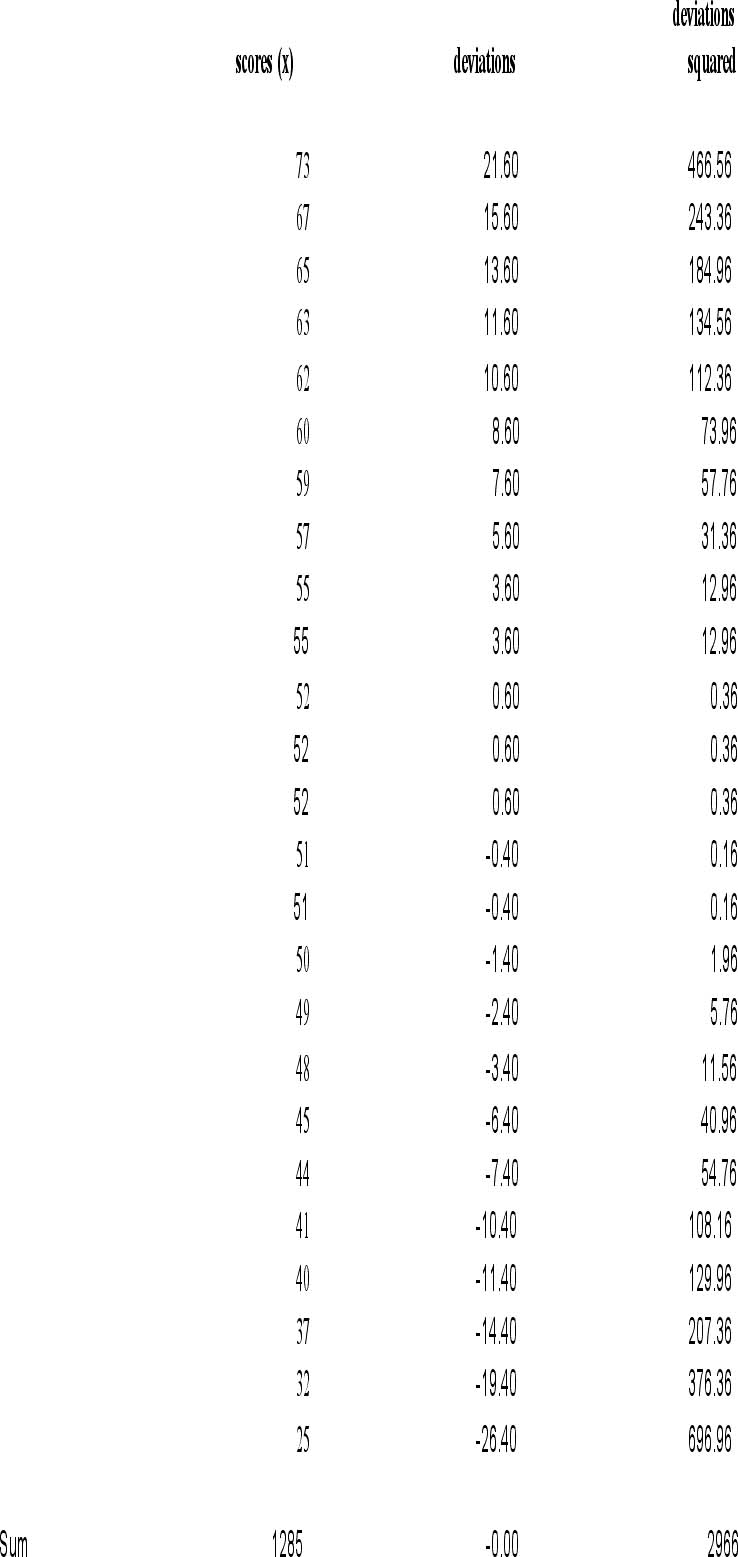
Vocabulary: Measures of Central Tendency - Numbers that represent the average or typical score obtained from measurements of a sample. Mean, median and mode are the three most common measures of central tendency. Measures of Variability - Numbers that indicate how much scores differ from each other and the measure of central tendency in a set of scores. These will be covered in detail in later chapters, but variance and standard deviation are two examples of measures of variability. Mode - The most frequently occurring score in a distribution of scores. For our BASC data, the mode is 52, because there are 3 subjects who scored 52. Unimodal - a distribution with one mode. Our BASC data is unimodal. Bimodal - a distribution with two modes. Multimodal - a distribution with more than two modes. Median - A score value in the distribution with an equal number of scores above and below it. The median is the 50th percentile in a distribution. The median for our BASC scores is also 52, because the 13th score when they are in rank order is 52. Sample mean ( Population mean ( Sum of squares (SS) - A numerical value obtained by subtracting the mean of a distribution from each score in the distribution, squaring each difference, and then summing the differences. This number by itself means very little, but it is a key component of many statistical calculations. |

