I. Markets and Competition
A. What Is a
Market?
1. Definition of market:.......
2. Markets can
take many forms and may be organized (agricultural commodities) or less
organized (ice cream).
B. What Is
Competition?
1. Definition of competitive market:...................
2. Each buyer knows that there are several sellers from which to choose. Sellers know that each buyer purchases only a small amount of the total amount sold.
C. In this
chapter, we will assume that markets are perfectly competitive.
1.
Characteristics of a perfectly competitive market:
2. Because
buyers and sellers must accept the market price as given, they are often called
"price takers."
D.
We will start by studying perfect competition.
1. Perfectly
competitive markets are the easiest to analyze because buyers and sellers take
the price as a given.
2. Because some
degree of competition is present in most markets, many of the lessons that we
learn by studying supply and demand under perfect competition apply in more
complicated markets.
II. Demand
A. The Demand
Curve: The Relationship between Price and Quantity Demanded
1. Definition
of quantity demanded: the amount
of a good that buyers are willing and able to purchase.
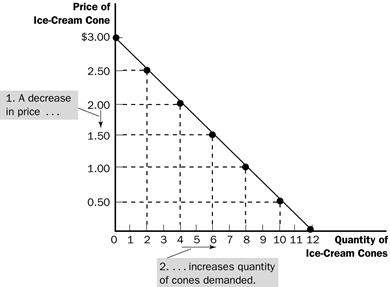
2. One
important relationship of quantity demanded is the price of the product.
b. Definition of law of demand:...............
3. Definition of demand schedule:..................
|
Price of Ice Cream Cone |
Quantity of Cones Demanded |
|
|
$0.00 |
12 |
|
|
$0.50 |
10 |
|
|
$1.00 |
8 |
|
|
$1.50 |
6 |
|
|
$2.00 |
4 |
|
|
$2.50 |
2 |
|
|
$3.00 |
0 |
|
4. Definition of demand curve:.........
Here is an example
B. Market
Demand versus Individual Demand
C. Shifts in
the Demand Curve
1. Because the
market demand curve holds other things constant, it need not be stable over
time.
2. If any of
these other factors change, the demand curve will shift.
a. An increase
in demand is represented by a shift of the demand curve to the right.
b. A decrease
in demand is represented by a shift of the demand curve to the left.
3. Income
b. Definition of normal good:..................
c. Definition of inferior good:......................
4. Prices of
Related Goods
a. Definition of substitutes:....................
b. Definition of complements:...................
5. Tastes
6. Expectations
7. Number of
Buyers
III. Supply
A.
The Supply Curve: The Relationship between Price and Quantity Supplied
1. Definition of quantity supplied:....................
a. Quantity
supplied is positively related to price. This implies that the supply curve will
be upward sloping.
b. Definition
of law of supply:.....................
2. Definition of supply schedule:......................
3. Definition of supply curve:.....................
Here are the examples
|
Price of Ice Cream Cone |
Quantity of Cones Supplied |
|
$0.00 |
0 |
|
$0.50 |
0 |
|
$1.00 |
1 |
|
$1.50 |
2 |
|
$2.00 |
3 |
|
$2.50 |
4 |
|
$3.00 |
5 |

B. Market
Supply versus Individual Supply
C. Shifts in the Supply Curve
1. Because the
market supply curve holds other things constant, the supply curve will shift if
any of these factors changes.
a. An increase
in supply is represented by a shift of the supply curve to the right.
b. A decrease
in supply is represented by a shift of the supply curve to the left.
2. Input Prices
3. Technology
4. Expectations
5. Number of
Sellers
IV. Supply and Demand
Together
A. Equilibrium
1. The point
where the supply and demand curves intersect is called the market’s equilibrium.
2. Definition of equilibrium:.....................
3. Definition
of equilibrium price:...................
4. The
equilibrium price is often called the "market-clearing" price because both
buyers and sellers are satisfied at this price.
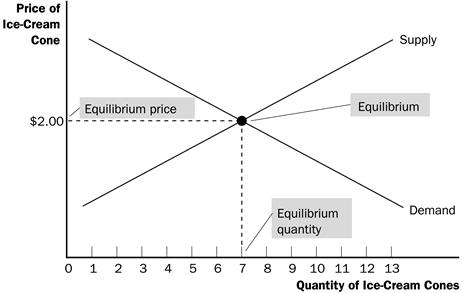
5. Definition of equilibrium quantity:.............
6. If the
actual market price is higher than the equilibrium price, there will be a
surplus of the good.

a. Definition of surplus:.................
b. To
eliminate the surplus, producers will lower the price until the market reaches
equilibrium.
7. If the
actual price is lower than the equilibrium price, there will be a shortage of
the good.
a. Definition of shortage:.................
b. Sellers
will respond to the shortage by raising the price of the good until the market
reaches equilibrium.
B. Three Steps to Analyzing Changes in Equilibrium
1. Decide
whether the event shifts the supply or demand curve (or perhaps both).
2. Determine
the direction in which the curve shifts.
3. Use the
supply-and-demand diagram to see how the shift changes the equilibrium price and
quantity.
D. Shifts in
Curves versus Movements along Curves
I.
Controls on Prices
A. Definition of price ceiling:.................
B. Definition of price floor:.................
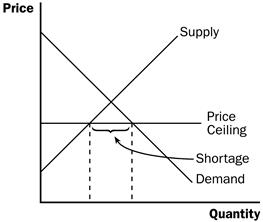
C. How Price Ceilings Affect Market Outcomes
1. There are
two possible outcomes if a price ceiling is put into place in a market.
a. If the
price ceiling is higher than or equal to the equilibrium price, it is not
binding and has no effect on the price or quantity sold.
b. If the
price ceiling is lower than the equilibrium price, the ceiling is a binding
constraint and a shortage is created.
2. If a
shortage for a product occurs (and price cannot adjust to eliminate it), a
method for rationing the good must develop.
3. Not all
buyers benefit from a price ceiling because some will be unable to purchase the
product.
4.
Case Study: Lines at the Gas Pump
a. In 1973,
OPEC raised the price of crude oil, which led to a reduction in the supply of
gasoline.
b. The federal
government put a price ceiling into place and this created large shortages.
c.
Motorists were forced to spend large amounts of time in line at the gas pump
(which is how the gas was rationed).
d. Eventually,
the government realized its mistake and repealed the price ceiling.
5. Case Study: Rent Control in the Short Run and the Long Run
a. The goal of
rent control is to make housing more affordable for the poor.
b. Because the
supply of apartments is fixed (perfectly inelastic) in the short run and upward
sloping (elastic) in the long run, the shortage is much larger in the long run
than in the short run.
c.
Rent-controlled apartments are rationed in a number of ways including long
waiting lists, discrimination against minorities and families with children, and
even under-the-table payments to landlords.
d. The quality
of apartments also suffers due to rent control.
D. How Price
Floors Affect Market Outcomes
1. There are two possible outcomes if a price floor is put into place in a market.
a. If the
price floor is lower than or equal to the equilibrium price, it is not binding
and has no effect on the price or quantity sold.
b. If the
price floor is higher than the equilibrium price, the floor is a binding
constraint and a surplus is created.

2.
Case Study: The Minimum Wage
a. The market
for labor looks like any other market: downward-sloping demand, upward-sloping
supply, an equilibrium price (called a wage), and an equilibrium quantity of
labor hired.
b. If the
minimum wage is above the equilibrium wage in the labor market, a surplus of
labor will develop (unemployment).
c. The
minimum wage will be a binding constraint only in markets where equilibrium
wages are low.
d. Thus, the
minimum wage will have its greatest impact on the market for teenagers and other
unskilled workers.
E. Evaluating
Price Controls
1. Because most
economists feel that markets are usually a good way to organize economic
activity, most oppose the use of price ceilings and floors.
a. Prices
balance supply and demand and thus coordinate economic activity.
b. If prices are set by laws, they obscure the signals that efficiently allocate scarce resources.
2. Price
ceilings and price floors often hurt the people they are intended to help.
a. Rent
controls create a shortage of quality housing and provide disincentives for
building maintenance.
b. Minimum wage laws create higher rates of unemployment for teenage and low skilled workers.
3.
In the News: President Chavez Versus the
Market
a.
b. This
Wall Street Journal article describes the problems generated in