
I. Introduction
What is economics
What is the fundamental economic problem?
II. How People
Make Decisions
Principle #1: People Face Trade-offs
What do I mean by “There ain’t no such thing as a free lunch.”?
Provide your own tradeoff examples.
A special example of a trade-off is the trade-off between
efficiency and equality.
What is efficiency
What is equity
Principle #2:
The Cost of Something Is What You Give Up to Get It
Making
decisions requires individuals to consider the benefits and costs of some
action.
What are the
opportunity costs of going to college?
Principle #3:
Rational People Think at the Margin
Definition of marginal
changes: small incremental adjustments to a plan of action.
D. Principle #4:
People Respond to Incentives
Definition of
incentive: something that induces
a person to act.
III. How People Interact
Principle #5:
Trade Can Make Everyone Better Off
Trade is not
like a sports contest, where one side gains and the other side loses.
Principle #6: Markets Are Usually a
Many countries that
once had centrally planned economies have abandoned this system and are trying
to develop market economies.
Definition of
market economy: an economy that
allocates resources through the decentralized decisions of many firms and
households as they interact in markets for goods and services.
Market prices
reflect both the value of a product to consumers and the cost of the resources
used to produce it.
Adam Smith’s
1776 work suggested that although individuals are motivated by self-interest, an
invisible hand guides this self-interest into promoting society’s economic
well-being.
Smith’s
conclusions will be analyzed more fully in the chapters to come.
Principle #7: Governments Can Sometimes Improve Market Outcomes
The invisible hand will only work if price adjust properly.
Examples of Market
Failure
Definition of
externality: the impact of one
person’s actions on the well-being of a bystander.
Definition of
market power: the ability of a
single economic actor (or small group of actors) to have a substantial influence
on market prices.
Even though it is niot a market failure the government can improve equity.
IV. How the Economy as
a Whole Works
Principle #8: A
Country’s Standard of Living Depends on Its Ability to Produce Goods and
Services
The explanation
for differences in living standards lies in differences in productivity.
Definition of
productivity: the quantity of
goods and services produced from each unit of labor input.
High
productivity implies a high standard of living.
Principle #9: Prices Rise When the Government Prints Too Much
Money
Definition of
inflation: an increase in the
overall level of prices in the economy.
When the
government creates a large amount of money, the value of money falls, leading to
price increases.
Examples:
Principle #10:
Society Faces a Short-Run Trade-off between Inflation and Unemployment
The Economist as Scientist
Economists
Follow the Scientific Method.
Observations
help us to develop theory.
Data can be
collected and analyzed to evaluate theories.
Using data to
evaluate theories is more difficult in economics than in physical science
because economists are unable to generate their own data and must make do with
whatever data are available.
Thus,
economists pay close attention to the natural experiments offered by history.
Assumptions
Make the World Easier to Understand.
Example: to
understand international trade, it may be helpful to start out assuming that
there are only two countries in the world producing only two goods. Once we
understand how trade would work between these two countries, we can extend our
analysis to a greater number of countries and goods.
Economists
often use assumptions that are somewhat unrealistic but will have small effects
on the actual outcome of the answer.
The Circular Flow Diagram
Definition of
circular-flow diagram: a visual
model of the economy that shows how dollars flow through markets among
households and firms.
This diagram
is a very simple model of the economy. Note that it ignores the roles of
government and international trade.
There are two
decision makers in the model: households and firms.
There are two
markets: the market for goods and services and the market of factors of
production.
Firms
are sellers in the market for goods and services and buyers in the market for
factors of production.
Households
are buyers in the market for goods and services and sellers in the market for
factors of production.
The Production Possibilities Frontier
Production
possibilities frontier: a graph that shows the combinations of output that
the economy can possibly produce given the available factors of production and
the available production technology.
Because
resources are scarce, not every combination of computers and cars is possible.
Production at a point outside of the curve (such as C) is not possible given the
economy’s current level of resources and technology.
Production is
efficient at points on the curve (such as A and B). This implies that the
economy is getting all it can from the scarce resources it has available. There
is no way to produce more of one good without producing less of another.
Production at
a point inside the curve (such as D) is possible, but inefficient.
The production
possibilities frontier reveals Principle #1: People face tradeoffs.
Principle #2
is also shown on the production possibilities frontier: The cost of something is
what you give up to get it (opportunity cost).
The production possibilities frontier can shift if resource
availability or technology changes. Economic growth can be illustrated by an
outward shift of the production possibilities frontier.
Microeconomics and
Macroeconomics
Economics is
studied on various levels.
microeconomics:
the study of how households and firms make decisions and how they interact in
markets.
macroeconomics:
the study of economy-wide phenomena, including inflation, unemployment, and
economic growth.
Positive Versus
Normative Analysis
positive statements:
claims that attempt to describe the world as it is.
normative statements:
claims that attempt to prescribe how the world should be.
What Is a
Market?
market: a
group of buyers and sellers of a particular good or service.
Demand
The Demand
Curve: The Relationship between Price and Quantity Demanded
Definition of
quantity demanded: the amount of
a good that buyers are willing and able to purchase.
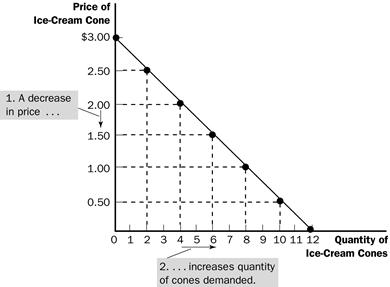
What is the law of demand
demand schedule: a
table that shows the relationship between the price of a good and the quantity
demanded.
|
Price of Ice Cream Cone |
Quantity of Cones Demanded |
|
|
$0.00 |
12 |
|
|
$0.50 |
10 |
|
|
$1.00 |
8 |
|
|
$1.50 |
6 |
|
|
$2.00 |
4 |
|
|
$2.50 |
2 |
|
|
$3.00 |
0 |
|
What is a demand curve and what does it look like in a graph?
The market demand is
the sum of all of the individual demands for a particular good or service.
Shifts in the Demand Curve
An increase
in demand is represented by a shift of the demand curve to the right.
A decrease in
demand is represented by a shift of the demand curve to the left.
Income
normal good:
a good for which, other things equal, an increase in income leads to an increase
in demand.
inferior good:
a good for which, other things equal, an increase in income leads to a decrease
in demand.
Prices of Related Goods
substitutes:
two goods for which an increase in the price of one good leads to an increase in
the demand for the other.
complements:
two goods for which an increase in the price of one good leads to a decrease in
the demand for the other.
Tastes
Expectations
Number of Buyers
Supply
A. The Supply
Curve: The Relationship between Price and Quantity Supplied
1. Definition
of quantity supplied: the amount
of a good that sellers are willing and able to sell.
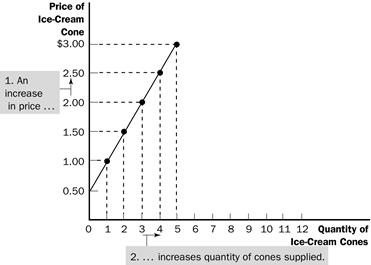
What is the law of supply?
supply schedule: a
table that shows the relationship between the price of a good and the quantity
supplied.
supply curve: a
graph of the relationship between the price of a good and the quantity supplied.
|
Price of Ice Cream Cone |
Quantity of Cones Supplied |
|
$0.00 |
0 |
|
$0.50 |
0 |
|
$1.00 |
1 |
|
$1.50 |
2 |
|
$2.00 |
3 |
|
$2.50 |
4 |
|
$3.00 |
5 |
The market
supply curve can be found by summing individual supply curves.
Shifts in the Supply Curve
An increase
in supply is represented by a shift of the supply curve to the right.
A decrease in
supply is represented by a shift of the supply curve to the left.
Input Prices
Technology
Expectations
Number of Sellers
supply and Demand Together
Equilibrium
The point
where the supply and demand curves intersect is called the market’s equilibrium.
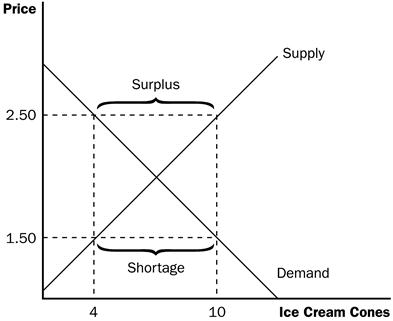
surplus: a
situation in which quantity supplied is greater than quantity demanded.
To eliminate
the surplus, producers will lower the price until the market reaches
equilibrium.
shortage: a
situation in which quantity demanded is greater than quantity supplied.
Sellers will
respond to the shortage by raising the price of the good until the market
reaches equilibrium.
As we stated and Adam Smith stated the market system is a good way to run an economy. However, sometimes we do not think the results are fair. One thing we can do is control the price.
Controls
on Prices
price ceiling: a
legal maximum on the price at which a good can be sold.
price floor: a
legal minimum on the price at which a good can be sold.

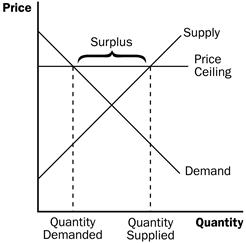
Price ceilings
and price floors often hurt the people they are intended to help.
Rent controls
create a shortage of quality housing and provide disincentives for building
maintenance.
Minimum wage
laws create higher rates of unemployment for teenage and low skilled workers.
;;
externality: the
uncompensated impact of one person’s actions on the well-being of a bystander.
If the impact
on the bystander is adverse, we say that there is a negative externality.
If the impact
on the bystander is beneficial, we say that there is a positive externality.
The factory in this example will produce at the market
level, or the productive efficient level
Definition of
internalizing an externality:
altering incentives so that people take account of the external effects of their
actions.
When an
externality causes a market to reach an inefficient allocation of resources, the
government can respond in two ways.
1.
Command-and-control policies regulate behavior directly like rules and laws.
2. Market-based
policies provide incentives so that private decisionmakers will choose to solve
the problem on their own, like taxes.
sfdhsh