I.
Markets and Competition
A. What Is a
Market?
1. Definition of market:
B. What Is
Competition?
1. Definition of competitive market:
C. In this
chapter, we will assume that markets are perfectly competitive.
1.
Characteristics of a perfectly competitive market:
a. The goods
being offered for sale are exactly the same.
b. The buyers
and sellers are so numerous that no single buyer or seller has any influence
over the market price.
2. Because
buyers and sellers must accept the market price as given, they are often called
"price takers."
3. Not all
goods are sold in a perfectly competitive market.
a. A market
with only one seller is called a monopoly market.
b. Other
markets fall between perfect competition and monopoly.
II. Demand
A. The Demand
Curve: The Relationship between Price and Quantity Demanded
1. Definition of quantity demanded:
Definition of law of demand:
Definition of
demand schedule:
|
Price of Ice Cream Cone |
Quantity of Cones Demanded |
|
|
$0.00 |
12 |
|
|
$0.50 |
10 |
|
|
$1.00 |
8 |
|
|
$1.50 |
6 |
|
|
$2.00 |
4 |
|
|
$2.50 |
2 |
|
|
$3.00 |
0 |
|
4. Definition
of demand curve:
a. Price is
drawn on the vertical axis.
b. Quantity
demanded is represented on the horizontal axis.

Shifts in the
Demand Curve
If any of these other factors change, the demand curve will
shift.
a. An increase
in demand is represented by a shift of the demand curve to the right.
b. A decrease
in demand is represented by a shift of the demand curve to the left.
Income
a. The
relationship between income and quantity demanded depends on what type of good
the product is.
b. Definition
of normal good: a good for which,
other things equal, an increase in income leads to an increase in demand.
c. Definition of inferior good: a good for which, other things equal, an increase in income leads to a decrease in demand.
Prices of Related
Goods
a. Definition
of substitutes: two goods for
which an increase in the price of one good leads to an increase in the demand
for the other.
b. Definition
of complements: two goods for
which an increase in the price of one good leads to a decrease in the demand for
the other.
Tastes
Expectations
a. Future
income
b. Future
prices
7. Number of Buyers
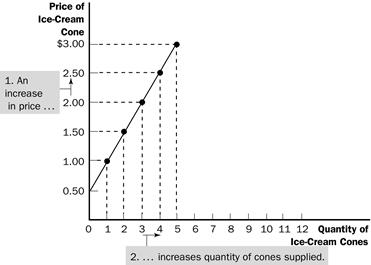
III. Supply
A.
The Supply Curve: The Relationship between Price and Quantity Supplied
1. Definition
of quantity supplied:
a. Quantity
supplied is positively related to price. This implies that the supply curve will
be upward sloping.
b. Definition of law of supply:
2. Definition of supply schedule:
3. Definition
of supply curve:
|
Price of Ice Cream Cone |
Quantity of Cones Supplied |
|
$0.00 |
0 |
|
$0.50 |
0 |
|
$1.00 |
1 |
|
$1.50 |
2 |
|
$2.00 |
3 |
|
$2.50 |
4 |
|
$3.00 |
5 |

2. Input Prices
3. Technology
4. Expectations
5. Number of
Sellers
IV. Supply and Demand
Together
A. Equilibrium
1. The point
where the supply and demand curves intersect is called the market’s equilibrium.
2. Definition of equilibrium:
3. Definition of equilibrium price:
4. The
equilibrium price is often called the "market-clearing" price because both
buyers and sellers are satisfied at this price.

5. Definition
of equilibrium quantity: the
quantity supplied and the quantity demanded at the equilibrium price.
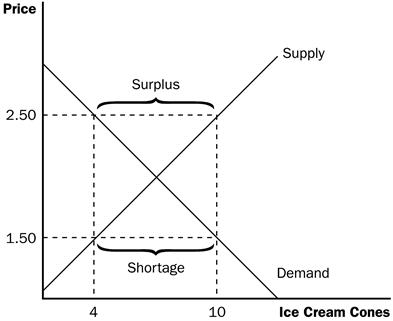
6. If the
actual market price is higher than the equilibrium price, there will be a
surplus of the good.

a. Definition
of surplus:
b. To
eliminate the surplus, producers will lower the price until the market reaches
equilibrium.
7. If the
actual price is lower than the equilibrium price, there will be a shortage of
the good.
a. Definition of shortage:
b. Sellers
will respond to the shortage by raising the price of the good until the market
reaches equilibrium.
B. Three Steps
to Analyzing Changes in Equilibrium
1. Decide
whether the event shifts the supply or demand curve (or perhaps both).
2. Determine
the direction in which the curve shifts.
3. Use the
supply-and-demand diagram to see how the shift changes the equilibrium price and
quantity.