Chapter Outline
I)
Demand,
supply and equilibrium in markets for goods and services
A.
Demand
for goods and services
1.
demand
and quantity demanded
2.
the law
of demand
3.
demand
schedule and demand curve
B.
Supply
of goods and services
1.
supply
and quantity supplied
2.
the law
of supply
3.
supply
schedule and supply curve
C.
Equilibrium – where demand and supply cross
1.
equilibrium price and equilibrium quantity
2.
excess
supply and excess demand
II)
Shifts
in demand and supply for goods and services
A.
The
ceteris paribus assumption
B.
An
example of a shifting demand curve
C.
Factors
that shift demand curves
1.
normal
goods and inferior goods
2.
substitutes and complements
D.
Summing
factors that shift demand
E.
An
example of a shift in a supply curve
F.
Factors
that shift supply curves
G.
Summing
up factors that change supply
A.
Good
weather for salmon fishing
B.
Seal
hunting and new drugs
C.
The
interconnections and speed of adjustment in real markets
A.
Price
ceilings
B.
Price
floors
C.
Responses to price controls: many margins for action
1.
black
market
D.
Policy
alternatives to price ceiling and price floors
A.
Consumer
surplus, producer surplus and price ceilings
B.
Inefficiency of price floors and price ceilings
1.
deadweight loss
A.
Adjustments occur without government oversight
B.
Demand
and Supply answer the Three Basic Questions
Here is my much more complete version.
I.
Markets and Competition
A.
What Is a Market?
C. In
this chapter, we will assume that markets are perfectly competitive.
2.
Not all goods are sold in a perfectly competitive market.
II.
Demand
a.
Quantity demanded is negatively related to price. This implies that the
demand curve is downward sloping.
2. Definition of demand schedule:
|
Price of Ice Cream Cone |
Quantity of Cones Demanded |
|
|
$0.00 |
12 |
|
|
$0.50 |
10 |
|
|
$1.00 |
8 |
|
|
$1.50 |
6 |
|
|
$2.00 |
4 |
|
|
$2.50 |
2 |
|
|
$3.00 |
0 |
|
4. Definition of demand curve:
a.
Price is drawn on the vertical axis.
B.
Market Demand versus Individual Demand
1.
The market demand is the horizontal sum of all of the individual demands
for a particular good or service.
C.
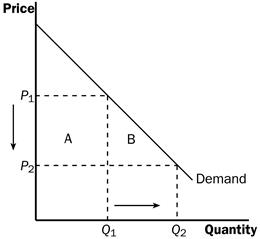
Shifts in the Demand Curve
a. An
increase in demand is represented by a shift of the demand curve to the right.
b.
A decrease in demand is represented by a shift of the demand curve to the
left.
3.
Income
Definition of inferior good:
4.
Prices of Related Goods
Definition of substitutes:
Definition of complements:
5.
Tastes
III.
Supply
A.
The Supply Curve: The Relationship between Price and Quantity Supplied
1. Definition of quantity supplied:
a.
Quantity supplied is positively related to price. This implies that the
supply curve will be upward sloping.
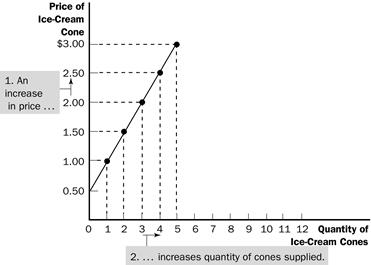
2. Definition of supply schedule:
3. Definition of supply curve:
|
Price of Ice Cream Cone |
Quantity of Cones Supplied |
|
$0.00 |
0 |
|
$0.50 |
0 |
|
$1.00 |
1 |
|
$1.50 |
2 |
|
$2.00 |
3 |
|
$2.50 |
4 |
|
$3.00 |
5 |
C.
Shifts in the Supply Curve
1.
Because the market supply curve holds other things constant, the supply
curve will shift if any of these factors changes.
a.
An increase in supply is represented by a shift of the supply curve to
the right.
b.
A decrease in supply is represented by a shift of the supply curve to the
left.
![]()
2.
Input Prices
3.
Technology
4.
Expectations
5.
Number of Sellers
IV.
Supply and Demand Together
A.
Equilibrium
1.
The point where the supply and demand curves intersect is called the
market’s equilibrium.
2. Definition of equilibrium:
3. Definition of equilibrium price:
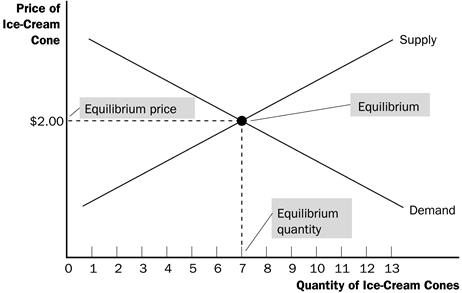
5.
Definition of equilibrium
quantity: the quantity supplied and the quantity demanded at the equilibrium
price.
6.
If the actual market price is higher than the equilibrium price, there
will be a surplus of the good.
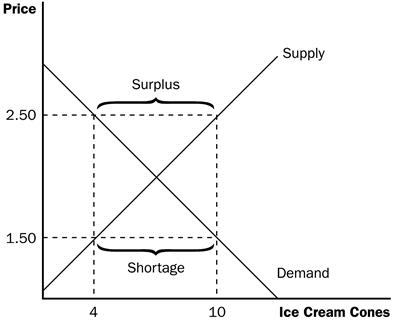
a. Definition of surplus:
b.
To eliminate the surplus, producers will lower the price until the market
reaches equilibrium.
7.
If the actual price is lower than the equilibrium price, there will be a
shortage of the good.
a. Definition of shortage:
b.
Sellers will respond to the shortage by raising the price of the good
until the market reaches equilibrium.
8.
Definition of the law of
supply and demand: the claim that the price of any good adjusts to bring the
supply and demand for that good into balance.
B.
Three Steps to Analyzing Changes in Equilibrium
1.
Decide whether the event shifts the supply or demand curve .
2.
Determine the direction in which the curve shifts.
3.
Use the supply-and-demand diagram to see how the shift changes the
equilibrium price and quantity.
D.
Shifts in Curves versus Movements along Curves
1.
A shift in the demand curve is called a "change in demand." A shift in
the supply curve is called a "change in supply."
I.
Controls on Prices
A. Definition of price ceiling:
B. Definition of price floor:
C. How Price Ceilings Affect Market Outcomes
1.
There are two possible outcomes if a price ceiling is put into place in a
market.
a.
If the price ceiling is higher than or equal to the equilibrium price, it
is not binding and has no effect on the price or quantity sold.
b.
If the price ceiling is lower than the equilibrium price, the ceiling is
a binding constraint and a shortage is created.

2.
If a shortage for a product occurs (and price cannot adjust to eliminate
it), a method for rationing the good must develop.
3.
Not all buyers benefit from a price ceiling because some will be unable
to purchase the product.
5.
Case Study: Rent Control in the
Short Run and the Long Run
a.
The goal of rent control is to make housing more affordable for the poor.
b.
Rent-controlled apartments are rationed in a number of ways including
long waiting lists, discrimination against minorities and families with
children, and even under-the-table payments to landlords.
c.
The quality of apartments also suffers due to rent control.
D.
How Price Floors Affect Market Outcomes
1.
There are two possible outcomes if a price floor is put into place in a
market.
a.
If the price floor is lower than or equal to the equilibrium price, it is
not binding and has no effect on the price or quantity sold.
b.
If the price floor is higher than the equilibrium price, the floor is a
binding constraint and a surplus is created.

2.
Case Study: The Minimum Wage
a.
The market for labor looks like any other market: downward-sloping
demand, upward-sloping supply, an equilibrium price (called a wage), and an
equilibrium quantity of labor hired.
b.
If the minimum wage is above the equilibrium wage in the labor market, a
surplus of labor will develop (unemployment).
c.
The minimum wage will be a binding constraint only in markets where
equilibrium wages are low.
d.
Thus, the minimum wage will have its greatest impact on the market for
teenagers and other unskilled workers.
E.
Evaluating Price Controls
1.
Because most economists feel that markets are usually a good way to
organize economic activity, most oppose the use of price ceilings and floors.
a.
Prices balance supply and demand and thus coordinate economic activity.
b. If prices are set by laws, they obscure the signals that efficiently allocate scarce resources.
2.
Price ceilings and price floors often hurt the people they are intended
to help.
a.
Rent controls create a shortage of quality housing and provide
disincentives for building maintenance.
b.
Minimum wage laws create higher rates of unemployment for teenage and low
skilled workers.is market intervention.