The textbook was so concise in this area and I wanted to do give you more. This study guide is almost completely the extra parts. I will include parts from the text, but for the most part I will omit that here and let you read the text.
I. Review
of the Definitions of Microeconomics and Macroeconomics
A. Definition
of microeconomics:
B. Definition of macroeconomics:
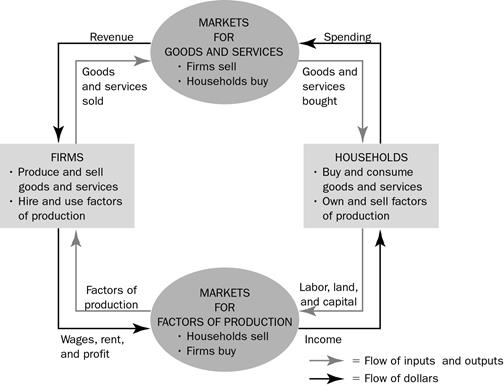
II. The
Economy’s Production, Income and Expenditure
B. For an
economy as a whole, total income must equal total expenditure and they must
equal total production.
a. Households
buy goods and services from firms; firms use this money to pay for resources
purchased from households.
b. In the
simple economy described by this circular-flow diagram, calculating GDP could be
done by adding up the total purchases of households or summing total income
earned by households.
c. Note
that this simple diagram is somewhat unrealistic as it omits saving, taxes,
government purchases, and investment purchases by firms. However, because a
transaction always has a buyer and a seller, total expenditure in the economy
must be equal to total income.
III. The Measurement of
Gross Domestic Product
A. Definition
of gross domestic product (GDP):
B. “GDP Is the
Market Value . . .”
C. “. . . Of All . . .”
D. “. . . Final . . .”
E. “. . . Goods and Services . . .”
F. “. . . Produced . . .”
G. “. . . Within a Country . . .”
H. “. . . in a Given Period of Time.”
FYI: Other Measures of Income
Gross National
Product (GNP) is the total income earned by a nation’s permanent residents.
IV. The Components of
GDP
A. GDP (Y
) can be divided into four components: consumption (C
), investment (I ),
government purchases (G ),
and net exports (NX ).
![]()
B. Definition
of consumption:
C. Definition of investment:
D. Definition of government purchases:
E. Definition of net exports:
V. Real Versus
Nominal GDP
A. There are
two possible reasons for total spending to rise from one year to the next.
B. When
studying GDP over time, economists would like to know if output has changed (not
prices).
C. Thus,
economists measure real GDP by valuing output using a fixed set of prices.
D. A Numerical Example
1. Two goods
are being produced: hot dogs and hamburgers.
|
Year |
Price of
Hot Dogs |
Quantity of
Hot Dogs |
Price of Hamburgers |
Quantity of Hamburgers |
|
2008 |
$1 |
100 |
$2 |
50 |
|
2009 |
$2 |
150 |
$3 |
100 |
|
2010 |
$3 |
200 |
$4 |
150 |
2. Definition
of nominal GDP: the production of
goods and services valued at current prices.
Nominal GDP for 2008 = ($1 × 100) + ($2 × 50) = $200.
Nominal GDP for 2009 = ($2 × 150) + ($3 × 100) = $600.
Nominal GDP for 2010 = ($3 × 200) + ($4 × 150) = $1,200.
3. Definition
of real GDP: the production of
goods and services valued at constant prices.
Let’s assume that the base year is 2008.
Real GDP for 2008 = ($1 × 100) + ($2 × 50) = $200.
Real GDP for 2009 = ($1 × 150) + ($2 × 100) = $350.
Real GDP for 2010 = ($1 × 200) + ($2 × 150) = $500.
E. Because real GDP is unaffected by changes in prices over time, changes in real GDP reflect changes in the amount of goods and services produced.
F. The GDP
Deflator
1. Definition
of GDP deflator: a measure of the
price level calculated as the ratio of nominal GDP to real GDP times 100.
![]()
2. Example
Calculations
GDP Deflator for 2008 = ($200 / $200) × 100 = 100.
GDP Deflator for 2009 = ($600 / $350) × 100 = 171.
GDP Deflator for 2010 = ($1200 / $500) × 100 = 240.
I. Would
you rather have 55K today or 55K in 1900 and all 1900 techno
This is why we like growth
Because of different growth rates, the ranking of countries by
income per person changes over time.
a. In the late
19th century, the United Kingdom was the richest country in the world.
b. Today,
income per person is lower in the United Kingdom than in the United States and
Canada (two former colonies of the United Kingdom).
II.
Productivity: Its Role and Determinants
Why Productivity Is So Important?
Definition of
productivity is…..
How Productivity Is Determined?
A production function describes……..
Growth Dynamics: Our Growth
Model
A. Setup of the Model
1. Basic assumptions
a. Population and work force grow at the same rate n.
b. Closed economy and there are no government purchases of goods and
services
therefore
![]()
c. Rewrite the equation in per capita (per worker) terms by dividing by
the size of
the labor force Nt Denote
per worker values in lower cases
![]()
d. kt is the
capital to labor ratio
2. The production function can
also be represented in per worker terms
a.
![]()
b. Can plot the per-worker production function assuming no productivity growth.
3. Steady states
a. In the steady state the per-capita levels of output, capital and consumption will be constant over time.
(labor force and capital grow at the same
rate…)
sf(k) = (n + d)k
kss is the only
possible steady state capital labor ratio it is where saving is equal to the steady
state level of investment.
If k does not equal kss then
the economy will converge to the steady state level
if k<kss
Then saving > investment needed to keep k constant so k increases
if k>kss Then
saving < investment needed to keep k constant so k decreases
Higher saving rate leads to a
higher capital labor ratio, higher output per worker and consumption per worker
depends on the golden rule.
·
Should policy increase the saving rate?
May lower consumption in the short run, but will increase output per
worker. Trade-off
between future and present consumption
·
Population growth lowers the capital output ratio, lowers consumption per worker
·
Productivity growth
The key factor in determining economic growth – increase the output
worker for a giving level of capital labor ratio
III. Government Policy to
Raise Long Run Living Standards
How can saving be increased?
How can we improve Infrastructure?
How can we build Human Capital?
How can we increase Investment from Abroad
a. Foreign
direct investment occurs when a capital investment is owned and operated by a
foreign entity.
b. Foreign
portfolio investment occurs when a capital investment is financed with foreign
money but operated by domestic residents.
How can we improve Health and Nutrition
Other things being equal, healthier workers are more productive.
How does the US protect Property Rights and promote Political
Stability
How can we promote Free Trade
How can we increase Research and Development