
The non-comprehensive part of the final will be over the unemployment chapter and the inflation chapter
I. who should be unemployed
On the surface this seems easy—those that do not work
But what about stay at home moms—individuals what are not willing
to work for low wages at available jobs
Unemployment can be divided into two categories.
A. The
economy’s natural rate of unemployment refers to the amount of unemployment that
the economy normally experiences.
B. Cyclical
unemployment refers to the year-to-year fluctuations in unemployment around its
natural rate.
II. Identifying
Unemployment
A. How Is
Unemployment Measured?
1. The Bureau
of Labor Statistics (BLS) surveys 60,000 households every month.
2. The BLS places each adult (age 16 or older) into one of three categories: employed, unemployed, or not in the labor force.
3. Definition of labor force:....
4. Definition of unemployment rate:.....
5. Definition of labor-force participation rate: the percentage of the adult population that is in the labor force.
a. Women ages
20 and older have lower labor-force participation rates than men, but have
similar rates of unemployment.
b. Blacks ages
20 and older have similar labor-force participation rates to whites, but have
higher rates of unemployment.
c. Teenagers have lower labor-force participation rates than adults, but have higher unemployment rates.
B. Definition of the natural rate of unemployment:........
C. Definition
of cyclical unemployment:
F. Does the
Unemployment Rate Measure What We Want It To?
1. Measuring
the unemployment rate is not as straightforward as it may seem.
2. There is a
tremendous amount of movement into and out of the labor force.
a. Many of the
unemployed are new entrants or reentrants looking for work.
b. Many
unemployment spells end with a person leaving the labor force as opposed to
actually finding a job.
3. There may be
individuals who are calling themselves unemployed to qualify for government
assistance, yet they are not trying hard to find work. These individuals are
more likely not a part of the true labor force, but they will be counted as
unemployed.
4. Definition of discouraged workers:...........
a. These
individuals will not be counted as part of the labor force.
b. Thus, while
they are likely a part of the unemployed, they will not show up in the
unemployment statistics.
H. Why Are
There Always Some People Unemployed?
1. In an ideal
labor market, wages would adjust so that the quantity of labor supplied and the
quantity of labor demanded would be equal.
2. However,
there is always unemployment even when the economy is doing well. The
unemployment rate is never zero; it fluctuates around the natural rate.
a. Definition of frictional unemployment:......
b. Definition of structural unemployment:.....
c. Three
possible reasons for structural unemployment are minimum-wage laws, unions, and
efficiency wages.
III. Job Search
A. Definition
of job search: the process by
which workers find appropriate jobs given their tastes and skills.
B. Because
workers differ from one another in terms of their skills and tastes and jobs
differ in their attributes, it is often difficult for workers to match with the
appropriate job.
C. Why Some
Frictional Unemployment Is Inevitable
1. Frictional
unemployment often occurs because of a change in the demand for labor among
different firms.
a. When
consumers decide to stop buying a good produced by Firm A and instead start
buying a good produced by Firm B, some workers at Firm A will likely lose their
jobs.
b. New jobs
will be created at Firm B, but it will take some time to move the displaced
workers from Firm A to Firm B.
c. The
result of this transition is temporary unemployment.
d. The same
situation can occur across industries and regions as well.
2. This implies
that, because the economy is always changing, frictional unemployment is
inevitable. Workers in declining industries will find themselves looking for new
jobs, and firms in growing industries will be seeking new workers.
D. Public
Policy and Job Search
1. The faster
information spreads about job openings and worker availability, the more rapidly
the economy can match workers and firms.
2. Government
programs can help to reduce the amount of frictional unemployment.
a.
Government-run employment agencies give out information on job vacancies.
b. Public
training programs can ease the transition of workers from declining to growing
industries and help disadvantaged groups escape poverty.
3. Critics of
these programs argue that the private labor market will do a better job of
matching workers with employers and therefore the government should not be
involved in the process of job search.
E.
Unemployment Insurance
1. Definition of unemployment insurance:.....
2. Because
unemployment insurance reduces the hardship of unemployment, it also increases
the amount of unemployment that exists.
IV. Minimum-Wage Laws
A. Unemployment can also occur because of minimum-wage laws.
B. The minimum
wage is a price floor.
1. If the
minimum wage is set above the equilibrium wage in the labor market, a surplus of
labor will occur.
2. However,
this is a binding constraint only when the minimum wage is set above the
equilibrium wage.
a. Most
workers in the economy earn a wage above the minimum wage.
b.
Minimum-wage laws therefore have the largest affect on workers with low skill
and little experience (such as teenagers).
C.
FYI: Who Earns the Minimum Wage?
1. In 2006, the
Department of Labor released a study concerning workers who reported earnings at
or below the minimum wage.
a. Of all
workers paid an hourly rate in the United States, about 2% of men and 3% of
women reported wages at or below the minimum wage.
b.
Minimum-wage workers tend to be young, with about half under the age of 25.
c.
Minimum-wage workers tend to be less educated. Of those workers ages 16 and over
with a high school education, only 2% earned the minimum wage.
d. The
industry with the highest proportion of workers with reported wages at or below
the minimum wage was leisure and hospitality.
e. The
proportion of workers earning the prevailing minimum wage has trended downward
since 1979.
D. Anytime a
wage is kept above the equilibrium level for any reason, the result is
unemployment.
1. Other causes
of this situation include unions and efficiency wages.
2. This
situation is different from frictional unemployment where the search for the
right job is the reason for
unemployment.
V. Unions and
Collective Bargaining
A. Definition of union:......
B. Unions play
a smaller role in the U.S. economy today than they did in the past. However,
unions continue to be prevalent in many European countries.
D. Are Unions
Good or Bad for the Economy?
1. Critics of
unions argue that unions are a cartel, which causes inefficiency because fewer
workers end up being hired at the higher union wage.
2. Advocates of
unions argue that unions are an answer to the problems that occur when a firm
has too much power in the labor market (for example, if it is the only major
employer in town). In addition, by representing workers’ views, unions help
firms provide the right mix of job attributes.
VI. The Theory of
Efficiency Wages
A. Definition of efficiency wages:......
B. Efficiency
wages raise the wage above the market equilibrium wage, resulting in
unemployment.
C. There are
several reasons why a firm may pay efficiency wages.
1. Worker
Health
a. Better-paid
workers can afford to eat better and can afford good medical care.
b. This is
more applicable in developing countries where inadequate nutrition can be a
significant problem.
2. Worker
Turnover
a. A firm can
reduce turnover by paying a wage greater than its workers could receive
elsewhere.
b. This is
especially helpful for firms that face high hiring and training costs.
3. Worker
Quality
a. Offering
higher wages attracts a better pool of applicants.
b. This is
especially helpful for firms that are not able to perfectly gauge the quality of
job applicants.
4.
Worker Effort
a. Again, if a
firm pays a worker more than he or she can receive elsewhere, the worker will be
more likely to try to protect his or her job by working harder.
b. This is
especially helpful for firms that have difficulty monitoring their workers.
INFlATION
I. The
inflation rate is measured as the percentage change in the Consumer Price Index,
the GDP deflator, or some other index of the overall price level.
A. Over the
past 100 years, prices have risen an average of about 4% per year in the United
States.
II. The Classical Theory of Inflation
A. The Level of
Prices and the Value of Money
1. When the
price level rises, people have to pay more for the goods and services that they
purchase.
2. A rise in
the price level also means that the value of money is now lower because each
dollar now buys a smaller quantity of goods and services.
3. If
P is the price level, then the
quantity of goods and services that can be purchased with $1 is equal to 1/P.
B. Money
Supply, Money Demand, and Monetary Equilibrium
1. The value of
money is determined by the supply and demand for money.
2. For the most
part, the supply of money is determined by the Fed.
a. This
implies that the quantity of money supplied is fixed (until the Fed decides to
change it).
b. Thus, the
supply of money will be vertical (perfectly inelastic).
3. The demand
for money reflects how much wealth people want to hold in liquid form.
a. One
variable that is very important in determining the demand for money is the price
level.
b. The higher prices are, the more money that is needed to perform transactions.
c. Thus,
a higher price level (and a lower value of money) leads to a higher quantity of
money demanded.
4. In the long
run, the overall price level adjusts to the level at which the demand for money
equals the supply of money.
a. If the
price level is above the equilibrium level, people will want to hold more money
than is available and prices will have to decline.
b. If the
price level is below equilibrium, people will want to hold less money than that
available and the price level will rise.
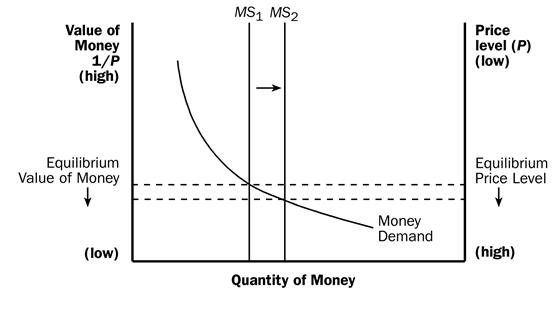
5. We can show
the supply and demand for money using a graph.
a. The
left-hand vertical axis is the value of money, measured by 1/P.
b. The
right-hand vertical axis is the price level (P
). Note that it is inverted—a high value of money means a low price
level and vice versa.
c. At
the equilibrium, the quantity of money demanded is equal to the quantity of
money supplied.
C. The Effects
of a Monetary Injection
1. Assume that
the economy is currently in equilibrium and the Fed suddenly increases the
supply of money.
2. The supply of money shifts to the right.
3. The
equilibrium value of money falls and the price level rises.
4. When an
increase in the money supply makes dollars more plentiful, the result is an
increase in the price level that makes each dollar less valuable.
5. Definition
of quantity theory of money: a
theory asserting that the quantity of money available determines the price level
and that the growth rate in the quantity of money available determines the
inflation rate.
D. A Brief Look
at the Adjustment Process
1. The
immediate effect of an increase in the money supply is to create an excess
supply of money.
2. People try
to get rid of this excess supply in a variety of ways.
a. They may
buy goods and services with the excess funds.
b. They may
use these excess funds to make loans to others by buying bonds or depositing the
money in a bank account. These loans will then be used to buy goods and
services.
c. In
either case, the increase in the money supply leads to an increase in the demand
for goods and services.
d. Because the
supply of goods and services has not changed, the result of an increase in the
demand for goods and services will be higher prices.
F. Velocity and
the Quantity Equation
1. Definition of velocity of money:.....
3. If P is the price level (the GDP deflator), Y is real GDP, and M is the quantity of money
5. Definition
of quantity equation: the
equation M ×
V =
P ×
Y, which relates the quantity of
money, the velocity of money, and the dollar value of the economy’s output of
goods and services.
a. The
quantity equation shows that an increase in the quantity of money must be
reflected in one of the other three variables.
b. Specifically, the price level must rise, output must rise, or velocity must fall.
c.
Figured in the text shows nominal GDP, the quantity of money (as measured by M2)
and the velocity of money for the United States since 1960. It appears that
velocity is fairly stable, while GDP and the money supply have grown
dramatically.
6. We can now
explain how an increase in the quantity of money affects the price level using
the quantity equation.
a. The
velocity of money is relatively stable over time.
b. When the
central bank changes the quantity of money (M
), it will proportionately change the nominal value of output (P
× Y ).
c. The economy’s output of goods and services (Y ) is determined primarily by available resources and technology.
d. This must
mean that P increases proportionately
with the change in M.
e. Thus, when the central bank increases the money supply rapidly, the result is a high level of inflation.
Do prices adjust as in the quantity equations or are they sticky?
The previous unemployment chapter indicates they are sticky and here are some more thoughts. They are old and have old-fasion names, but I ask you can they be updated?
Shoeleather
Costs
1. Because
inflation erodes the value of money that you carry in your pocket, you can avoid
this drop in value by holding less money.
2. However,
holding less money generally means more trips to the bank.
3. Definition
of shoeleather costs: the
resources wasted when inflation encourages people to reduce their money holdings.
4. This cost
can be considerable in countries experiencing hyperinflation.
C. Menu Costs
1. Definition
of menu costs: the costs of
changing prices.
2. During
periods of inflation, firms must change their prices more often.
D.
Relative-Price Variability and the Misallocation of Resources
1. Because
prices of most goods change only once in a while (instead of constantly),
inflation causes relative prices to vary more than they would otherwise.
2. When inflation distorts relative prices, consumer decisions are distorted and markets are less able to allocate resources to their best use.
F. Confusion
and Inconvenience
1. Money is the
yardstick that we use to measure economic transactions.
2. When
inflation occurs, the value of money falls. This alters the yardstick that we
use to measure important variables like incomes and profit.
I. The
Consumer Price Index
A. Definition of consumer price index (CPI):.......
B. How the Consumer Price Index Is Calculated
1. Fix the
basket.
a. The Bureau
of Labor Statistics uses surveys to determine a representative bundle of goods
and services purchased by a typical consumer.
2. Find the
prices.
a. Prices for
each of the goods and services in the basket must be determined for each time
period.
b. Example:
|
Year |
Price of
Hot Dogs |
Price of
Hamburgers |
|
2008 |
$1 |
$2 |
|
2009 |
$2 |
$3 |
|
2010 |
$3 |
$4 |
3. Compute the
basket’s cost.
a. By keeping
the basket the same, only prices are being allowed to change. This allows us to
isolate the effects of price changes over time.
b. Example:
Cost in 2008 = ($1 × 4) + ($2 × 2) = $8.
Cost in 2009 = ($2 × 4) + ($3 × 2) = $14.
Cost in 2010 = ($3 × 4) + ($4 × 2) = $20.
4. Choose a
base year and compute the index.
a. The base
year is the benchmark against which other years are compared.
b. The formula
for calculating the price index is:
c.
Example (using 2008 as the base year):
CPI for 2008 = ($8)/($8) × 100 = 100.
CPI for 2009 = ($14)/($8) × 100 = 175.
CPI for 2010 = ($20)/($8) × 100 = 250.
5. Compute the
inflation rate.
a. Definition of inflation rate: the percentage change in the price index from the preceding period.
b. The formula
used to calculate the inflation rate is:
![]()
c.
Example:
Inflation Rate for 2009 = (175 – 100)/100 × 100% = 75%.
Inflation Rate for 2010 = (250 – 175)/175 × 100% = 43%.
D. FYI: What Is in the CPI’s Basket?
The largest
category is housing, which makes up 43% of a typical consumer’s budget.t
improvements into account when computing the CPI.
F. Problems in
Measuring the Cost of Living
1. Substitution
Bias
a. When the
price of one good changes, consumers often respond by substituting another good
in its place.
b. The CPI
does not allow for this substitution; it is calculated using a fixed basket of
goods and services.
c. This
implies that the CPI overstates the increase in the cost of living over time.
2. Introduction
of New Goods
a. When a new
good is introduced, consumers have a wider variety of goods and services to
choose from.
b. This makes
every dollar more valuable, which lowers the cost of maintaining the same level
of economic well-being.
c.
Because the market basket is not revised often enough, these new goods are left
out of the bundle of goods and services included in the basket.
3. Unmeasured
Quality Change
a. If the
quality of a good falls from one year to the next, the value of a dollar falls;
if quality rises, the value of the dollar rises.
b. Attempts
are made to correct prices for changes in quality, but it is often difficult to
do so because quality is hard to measure.
4. The size of
these problems is also difficult to measure.
5. Most studies
indicate that the CPI overstates the rate of inflation by approximately one
percentage point per year.
6. The issue is
important because many government transfer programs (such as Social Security)
are tied to increases in the CPI.