Figure 1
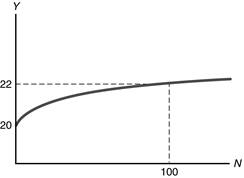
Figure 2
1.
(a)
Average labor productivity is output divided by employment:
2008: 12,000 tons of potatoes divided by 1000 workers
= 12 tons of potatoes per worker
2009: 14,300 tons of potatoes divided by 1100 workers
= 13 tons of potatoes per worker
(b) The growth rate of average labor
productivity is [(13/12) - 1]
´
100% = 8.33%.
(c) The unemployment rate is:
2008: (100 unemployed/1100
workers)
´
100% = 9.1%
2009: (50 unemployed/1150 workers)
´
100% = 4.3%
(d) The inflation rate is [(2.5/2)
- 1]
´
100% = 25%.
2.
Just because prices were lower in 1890 than they were in 2009 does not
mean that people were better off back then. People’s incomes have risen much
faster than prices have risen over the last 100 years, so they are better off
today in terms of real income.
3. Given data:
I =
40, G
= 30,
GNP
= 200, CA
= -20
=
NX
+ NFP,
T
=
60, TR
= 25,
INT
= 15, NFP
= 7 -
9 = -2.
Since GDP
=
GNP
- NFP,
GDP
= 200 - (-2)
= 202
= Y.
Since NX
+
NFP
= CA,
NX
= CA
-
NFP
= -20
- (-2)
= -18.
Since Y
=
C +
I +
G +
NX,
C =
Y -
(I
+ G
+
NX)
= 202 - (40
+ 30
+ (-18))
= 150.
Spvt
= (Y
+
NFP
-
T +
TR
+ INT)
-
C =
(202 + (-2)
- 60
+ 25 + 15)
-150
= 30. Sgovt
= (T
-
TR
- INT)
-
G =
(60 - 25
- 15)
- 30 =
-10.
S =
Spvt
+
Sgovt
= 30
+ (-10)
= 20.
(a) Consumption
= 150
(b)
Net exports =
-18
(c)
GDP =
202
(d) Net factor
payments from abroad =
-2
(e) Private
saving = 30
(f)
Government saving =
-10
(g) National
saving = 20
4.
|
Base-Year Quantities at Current-Year Prices |
|
At Base-Year Prices |
|
|
Apples |
3000
´ $3
= $
9,000 |
|
3000
´ $2
= $
6,000 |
|
Bananas |
6000
´ $2
=
$12,000 |
|
6000
´ $3
=
$18,000 |
|
Oranges |
8000
´ $5
=
$40,000 |
|
8000
´ $4
=
$32,000 |
|
Total |
$61,000 |
|
$56,000 |
|
Current-Year Quantities at Current-Year
Prices |
|
At Base-Year Prices |
|
|
Apples |
4,000
´ $3
= $
12,000 |
|
4,000
´ $2
= $
8,000 |
|
Bananas |
14,000
´ $2
= $
28,000 |
|
14,000
´ $3
= $
42,000 |
|
Oranges |
32,000
´ $5
=
$160,000 |
|
32,000
´ $4
=
$128,000 |
|
Total |
$200,000 |
|
$178,000 |
(a) Nominal GDP
is just the dollar value of production in a year at prices in that year. Nominal
GDP is $56 thousand in the base year and $200 thousand in the current year.
Nominal GDP grew 257% between the base year and the current year:
[($200,000/$56,000) - 1]
´
100% = 257%.
(b) Real GDP is
calculated by finding the value of production in each year at base-year prices.
Thus, from the table above, real GDP is
$56,000 in the base year and $178,000 in the current year. In percentage
terms, real GDP increases from the base year to the current year by
[($178,000/$56,000) - 1]
´
100% = 218%.
(c) The GDP
deflator is the ratio of nominal GDP to real GDP. In the base year, nominal GDP
equals real GDP, so the GDP deflator is 1. In the current year, the GDP deflator
is $200,000/$178,000 = 1.124. Thus the
GDP deflator changes by [(1.124/1) - 1]
´
100% = 12.4% from the base year to the
current year.
(d) Nominal GDP
rose 257%, prices rose 12.4%, and real GDP rose 218%, so most of the increase
in nominal GDP is because of the increase in real output, not prices. Notice
that the quantity of oranges quadrupled and the quantity of bananas more than
doubled.
5. The key to this
question is that real GDP is not the same thing as well-being. People may be
better off even if real GDP is lower; for example, this may occur because the
improvement in the health of workers is more valuable to society than the loss
of GDP due to the regulation. Ideally, we would like to be able to compare the
costs and benefits of such regulations; they should be put in place if the
overall costs (the reduced GDP in this case) are valued less than the overall
benefits (the workers’ health).
6. (a)
The problem in a planned economy is that prices do not measure market
value. When the price
of an item is too low, then goods are really more expensive than their listed
price suggests—we should include in their market value the value of time spent
by consumers waiting to make purchases. Because the item’s value exceeds its
cost, measured GDP is too low.
When the price of an item is too high, goods stocked on the shelves may
be valued too highly. This results in an overvaluation of firms’ inventories, so
that measured GDP is too high.
A possible strategy for dealing with
this problem is to have GDP analysts estimate what the market price
should be (perhaps by looking at prices of the same goods in market economies)
and use this “shadow” price in the GDP calculations.
(b) The goods
and services that people produce at home are not counted in the GDP figures
because they are not sold on the market, making their value difficult to
measure. One way to do it might be to look at the standard of living relative to
a market economy, and estimate what income it would take in a market economy to
support that standard of living.
7.
(a)
|
N |
Y |
MPN |
MRPN
(P
=
5) |
MRPN
(P
=
10) |
|
1 |
8 |
8 |
40 |
80 |
|
2 |
15 |
7 |
35 |
70 |
|
3 |
21 |
6 |
30 |
60 |
|
4 |
26 |
5 |
25 |
50 |
|
5 |
30 |
4 |
20 |
40 |
|
6 |
33 |
3 |
15 |
30 |
(b)
P =
$5.
(1) W
= $38. Hire one worker, since MRPN
($40) is greater than W ($38) at N
= 1. Do not hire two workers, since
MRPN ($35) is less than W ($38) at N
= 2.
(2) W
= $27. Hire three workers, since
MRPN ($30) is greater than W ($27) at N
= 3. Do not hire four workers, since
MRPN ($25) is less than W ($27) at N
= 4.
(3) W
= $22. Hire four workers, since MRPN
($25) is greater than W ($22) at N
= 4. Do not hire five workers, since
MRPN ($20) is less than W ($22) at N
= 5.
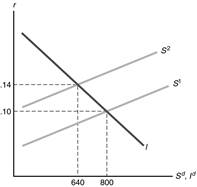
(c) Figure 1
plots the relationship between labor demand and the nominal wage. This graph is
different from a real labor demand curve because a labor demand curve shows the
relationship between labor demand and the real wage. Figure 2 shows the real
labor demand curve.
|
Figure 1 |
Figure 2 |
(d)
P =
$10. The table in part a shows the MRPN
for each N. At
W =
$38, the firm should hire five workers.
MRPN ($40) is greater than W
($38) at N
= 5. The firm shouldn’t hire six
workers, since MRPN ($30) is less
than W ($38) at
N =
6. With five workers, output is 30 widgets, compared to 8 widgets in part a when
the firm hired only one worker. So the increase in the price of the product
increases the firm’s labor demand and output.
(e) If output
doubles, MPN doubles, so
MRPN doubles. The
MRPN is the same as it was in part d
when the price doubled. So labor demand is the same as it was in part d. But the
output produced by five workers now doubles to 60 widgets.
(f) Since
MRPN
=
P
´
MPN,
then a doubling of either P or
MPN leads to a doubling of
MRPN. Since labor demand is chosen by
setting MRPN equal to
W,
the choice is the same, whether
P doubles or
MPN doubles.