8. Full-employment output is the level of output that firms supply when wages
and prices in the economy have fully adjusted; in the classical model of the
labor market, this occurs when the labor market is in equilibrium. When labor
supply increases, full-employment output increases, as there is now more labor
available to produce output. When a beneficial supply shock occurs, then the
same quantities of labor and capital produce more output, so full-employment
output rises. Furthermore,
a beneficial supply shock increases the demand for labor at each real wage and
leads to an increase in the equilibrium level of employment, which also
increases output.
9. The classical model of the labor market assumes that any worker who wants to work at the equilibrium real wage can find a job, so it is not very useful for studying unemployment.
1. (a) To find the growth of total factor productivity, you must first calculate the value of A in the production function. This is given by A
= Y/(K.3N.7). The growth rate of A can then be[(Ayear 2 – Ayear 1)/Ayear 1] ´ 100%. The result is:
|
A |
% increase in A |
|
|
1960 |
12.484 |
— |
|
1970 |
14.701 |
17.8% |
|
1980 |
15.319 |
4.2% |
|
1990 |
17.057 |
11.3% |
|
2000 |
19.565 |
14.7% |
(b) Calculate the marginal product of labor by seeing what happens to output when you add 1.0 to N; call this Y2, and the original level of output Y1. [A more precise method is to take the derivative of output with respect to N; dY/dN
= 0.7A(K/N).3. The result is the same (rounded).]
|
Y 1 |
Y 2 |
MPN |
|
|
1960 |
2502 |
2529 |
27 |
|
1970 |
3772 |
3805 |
33 |
|
1980 |
5162 |
5198 |
36 |
|
1990 |
7113 |
7155 |
42 |
|
2000 |
9817 |
9867 |
50 |
3. (a)
|
N |
Y |
MPN |
MRPN (P = 5) |
MRPN (P = 10) |
|
1 |
8 |
8 |
40 |
80 |
|
2 |
15 |
7 |
35 |
70 |
|
3 |
21 |
6 |
30 |
60 |
|
4 |
26 |
5 |
25 |
50 |
|
5 |
30 |
4 |
20 |
40 |
|
6 |
33 |
3 |
15 |
30 |
(b) P
= $5.(1) W
= $38. Hire one worker, since MRPN ($40) is greater than W ($38) at N = 1. Do not hire two workers, since MRPN ($35) is less than W ($38) at N = 2.(2) W
= $27. Hire three workers, since MRPN ($30) is greater than W ($27) at N = 3. Do not hire four workers, since MRPN ($25) is less than W ($27) at N = 4.(3) W
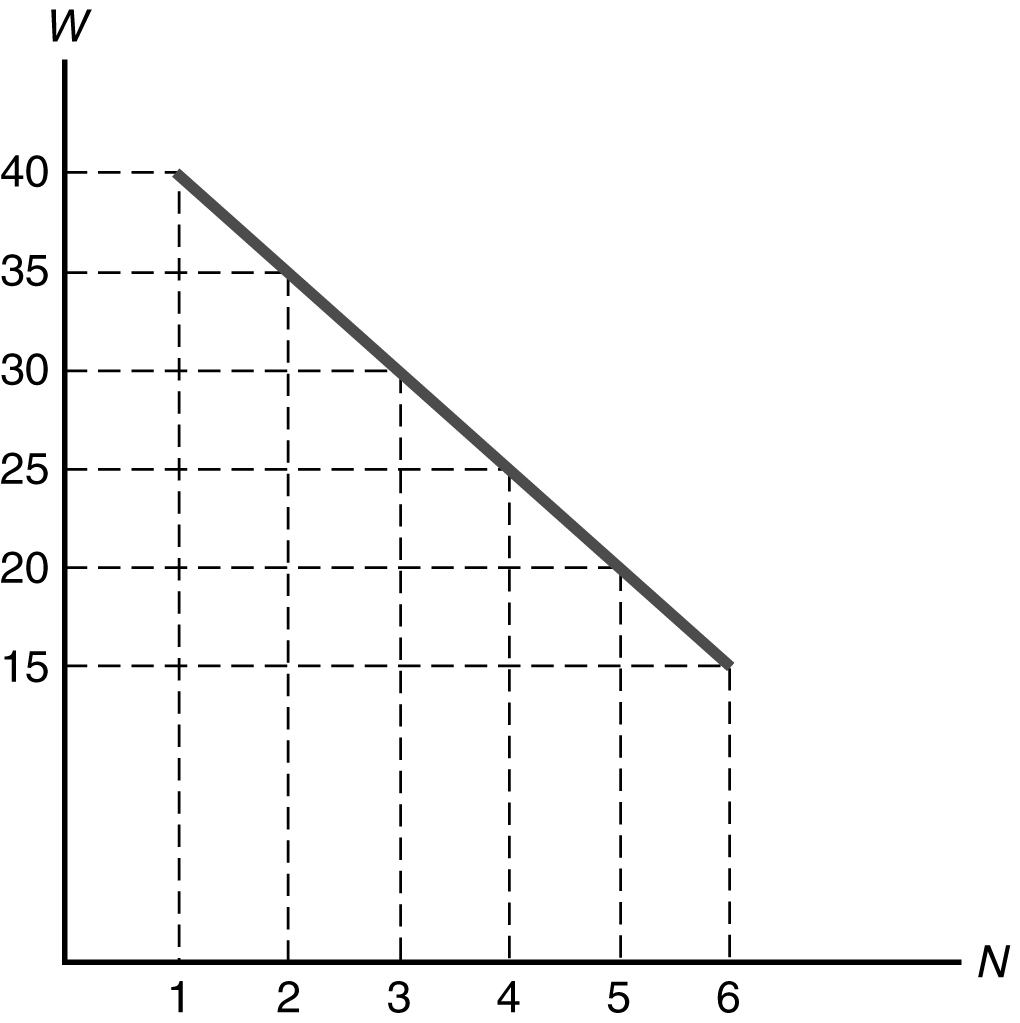
= $22. Hire four workers, since MRPN ($25) is greater than W ($22) at N = 4. Do not hire five workers, since MRPN ($20) is less than W ($22) at N = 5.(c) Figure 3.10 plots the relationship between labor demand and the nominal wage. This graph is different from a labor demand curve because a labor demand curve shows the relationship between labor demand and the real wage. Figure 3.11 shows the labor demand curve.
Figure 3.10
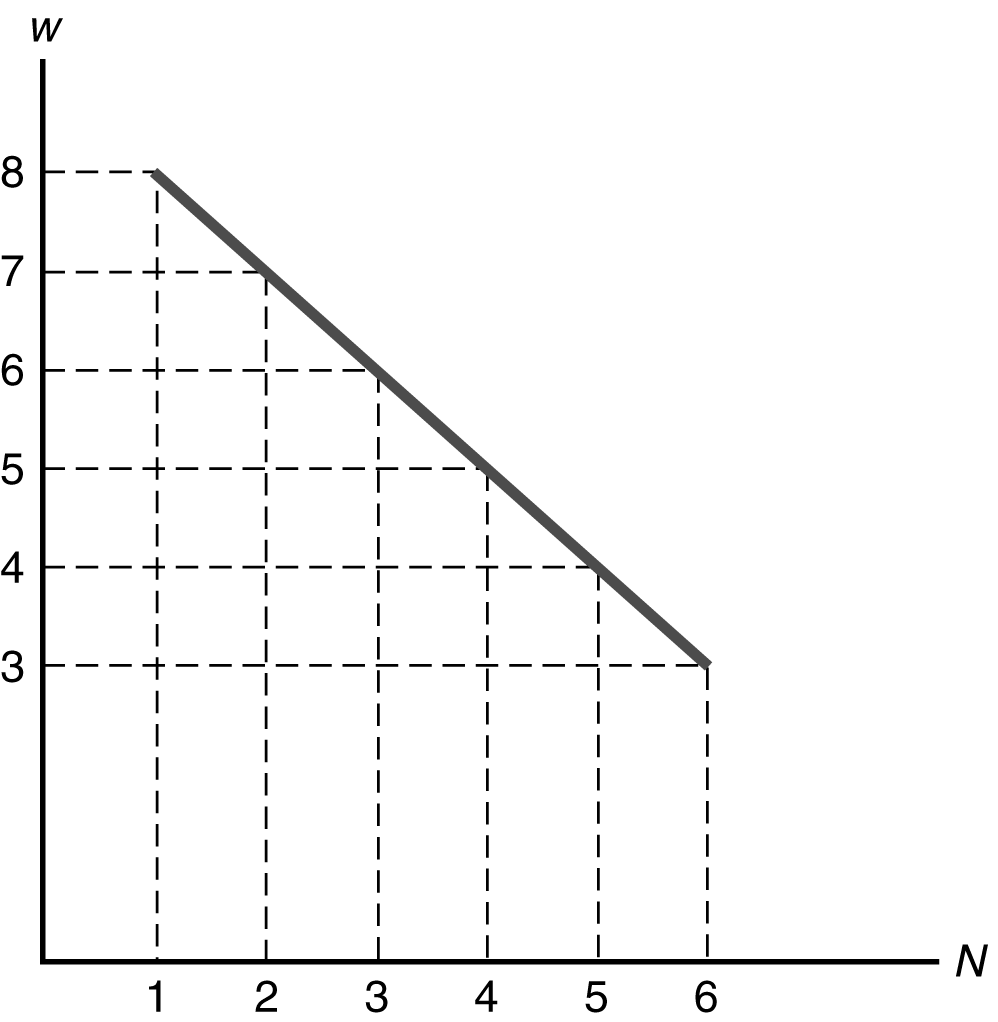
Figure 3.11
(d) P
= $10. The table in part a shows the MRPN for each N. At W = $38, the firm should hire five workers. MRPN ($40) is greater than W ($38) at N = 5. The firm shouldn’t hire six workers, since MRPN ($30) is less than W ($38) at N = 6. With five workers, output is 30 widgets, compared to 8 widgets in part a when the firm hired only one worker. So the increase in the price of the product increases the firm’s labor demand and output.(e) If output doubles, MPN doubles, so MRPN doubles. The MRPN is the same as it was in part d when the price doubled. So labor demand is the same as it was in part d. But the output produced by five workers now doubles to 60 widgets.
(f) Since MRPN
= P ´ MPN, then a doubling of either P or MPN leads to a doubling of MRPN. Since labor demand is chosen by setting MRPN equal to W, the choice is the same, whether5. (a) If the lump-sum tax is increased, there’s an income effect on labor supply, not a substitution effect (since the real wage isn’t changed). An increase in the lump-sum tax reduces a worker’s wealth, so labor supply increases.
(b) If T
= 35, then NS = 22 + 12w + (2 ´ 35) = 92 + 12 w. Labor demand is given by w = MPN =(c) Since the equilibrium real wage is below the minimum wage, the minimum wage is binding. With w
= 7, N = 154.5 – 7/2 = 151.0. Note that NS = 92 + (12 ´ 7) = 176, so NS > N and there is unemployment.6. Since w
= 4.5 K0.5 N–0.5, N–0.5 = 4.5 K0.5/w, so N = 20.25 K/w2. When K = 25, N = 506.25/w2.(a) If t
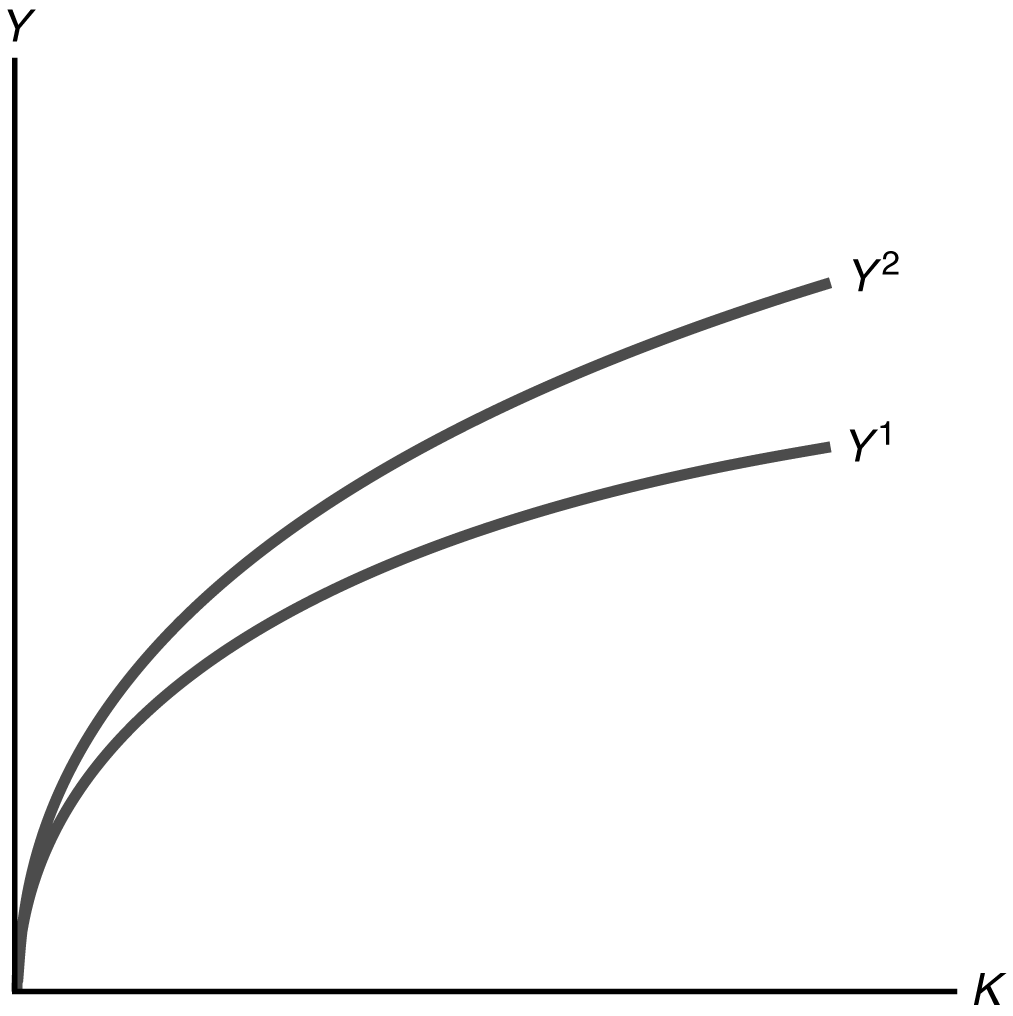
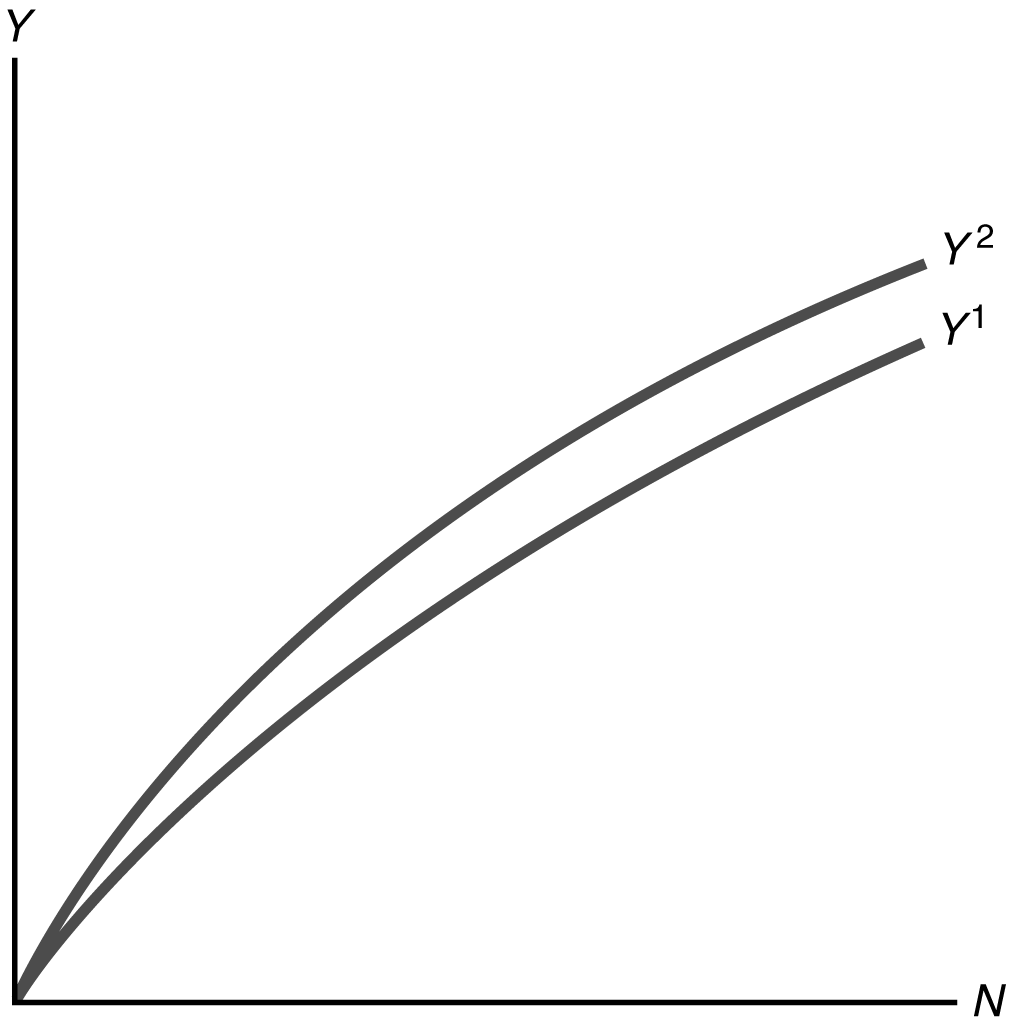
= 0.0, then NS = 100w2. Setting labor demand equal to labor supply gives 506.25/w2 = 100w2, so w4 = 5.0625, or w = 1.5. Then NS = 100 (1.5)2 = 225. [Check: N = 506.25/1.52 = 225.] Y = 45N0.5 = 45(225)0.5 = 675. The total after-tax wage income of workers is (1 – t) w NS = 1.5 ´ 225 = 337.5.1. (a) See Figures 3.13 and 3.14.
Figure 3.13
Figure 3.14
(b) In the initial situation, capital K1 and labor N1 produce output Y1; when productivity rises they produce output 1.1 Y1. Suppose that a small increase in capital to K2 with labor left at N1 produces output Y2 in the initial situation. Then it produces 1.1 Y2 when productivity rises by 10%. The marginal product of capital (MPK) in the initial situation is (Y2 – Y1)/(K2 – K1); when productivity rises the new MPK is (1.1 Y2 – 1.1 Y1)/(K2 – K1) = 1.1 (Y2 – Y1)/(K2 – K1). So the new MPK is 10% higher than the old MPK.
This argument is completely symmetric, so it holds for MPN as well. If you substitute N for K everywhere and follow the same steps, you will show that the new MPN is 10% higher than the old MPN.
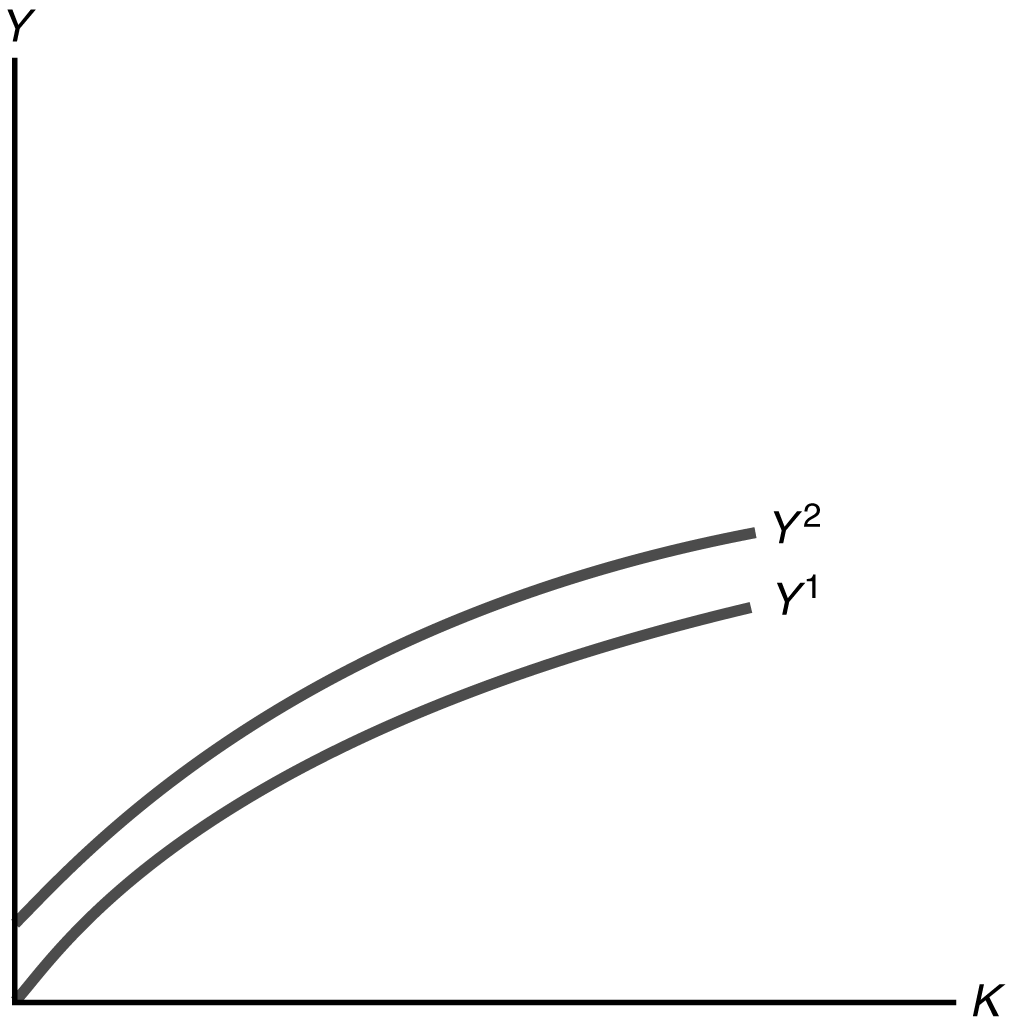
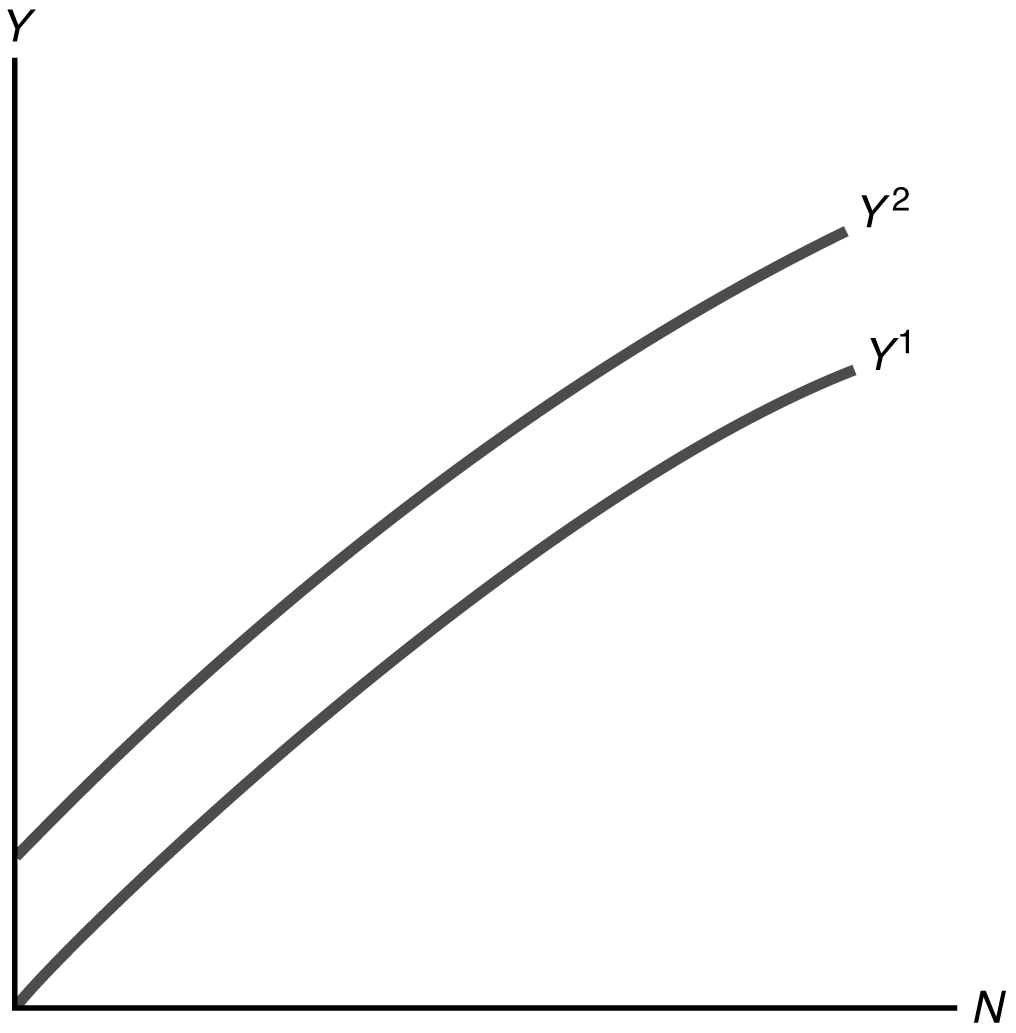
(c) Yes, it is possible for a beneficial productivity shock to leave the MPK and MPN unchanged. This could happen only if the shock was additive—that is, if it shifted the whole production function upward, but did not affect its slope at any point. In Figures 3.15 and 3.16 this is shown as a shift up in the production function, leaving the slope unchanged.
Figure 3.15
Figure 3.16
2. (a) An increase in the number of immigrants increases the labor force, increasing employment and increasing full-employment output.
(b) If energy supplies become depleted, this is likely to reduce productivity, because energy is a factor of production. So the reduction in energy supplies reduces full-employment output.
(c) Better education raises future productivity and output, but has no effect on current full-employment output.
(d) This reduction in the capital stock reduces full-employment output (although it may very well increase welfare).