So we can use either Eq. (4.7) or (4.8) to get to the same result.
(c) When G
2. (a) This chart shows the MPKf as the increase in output from adding another fabricator:
|
# Fabricators |
Output |
MPKf |
|
0 |
0 |
— |
|
1 |
100 |
100 |
|
2 |
150 |
50 |
|
3 |
180 |
30 |
|
4 |
195 |
15 |
|
5 |
205 |
10 |
|
6 |
210 |
5 |
(b) uc
(r d)pK (0.12 0.20)$100 $32. HHHHC should buy two fabricators, since at two fabricators, MPKf 50 32 uc. But at three fabricators, MPKf 30 32 uc. You want to add fabricators only if the future marginal product of capital exceeds the user cost of capital. The MPKf of the third fabricator is less than its user cost, so it should not be added.(c) When r
0.08, uc (0.08 0.20)$100 $28. Now they should buy three fabricators, sinceMPKf
30 28 uc for the third fabricator and MPKf 15 28 uc for the fourth fabricator.(d) With taxes, they should add additional fabricators as long as (1 –
)MPKf uc. Since 0.4,(e) When output doubles, the MPKf doubles as well. At r
0.12, they should buy three fabricators, since then MPKf 60 32 uc; they shouldn’t buy four, since then MPKf 30 32 uc.At r
0.08, they should buy four fabricators, since then MPKf 30 28 uc; they shouldn’t buy five, since then MPKf 20 28 uc.4. Since the price of capital declines from 60 to 51, the depreciation rate is 9/60
.15.(a) uc
(b) The desired capital stock is such that MPKf
uc, so 165 – 2K 15, or 2K 150, so K 75.(c) The tax-adjusted user cost of capital is uc/(1 –
), so with .4, the condition for the desired capital stock is 165 – 2K 15/0.6, or 2K 140; the solution is K 70. Thus taxation decreases the firm’s desired capital stock.(d) I wrestled with the best way to handle this. I decide that it is best to look at an investment tax credit as basically lowering the price of capital from 60 to (1 – 0.2)60
48. So the tax-adjusted user cost of capital is only (.25 ´ 48)/0.6 20. Then the equation for setting the desired capital stock is 165 – 2K 20, or 2K 145; the solution is K 72.5. Thus the investment tax credit increases the firm’s desired capital stock. Several ask me about this problem and I gave none a good answer so I will be very flexible on this part.6. (a) Sd
Y – Cd – G
Y – (3600 – 2000r 0.1Y) – 1200
–4800 2000r 0.9Y(b) (1) Using Eq. (4.7): Y Cd Id G
Y (3600 – 2000r 0.1Y) (1200 – 4000r) 1200
6000 – 6000r 0.1YSo 0.9Y 6000 – 6000r
At full employment, Y 6000. Solving 0.9 ´ 6000 6000 – 6000r, we get r 0.10.
(2) Using Eq. (4.8):
Sd
Id–4800 2000r 0.9Y 1200 – 4000r
0.9Y 6000 – 6000r
When Y 6000, r 0.10.
So we can use either Eq. (4.7) or (4.8) to get to the same result.
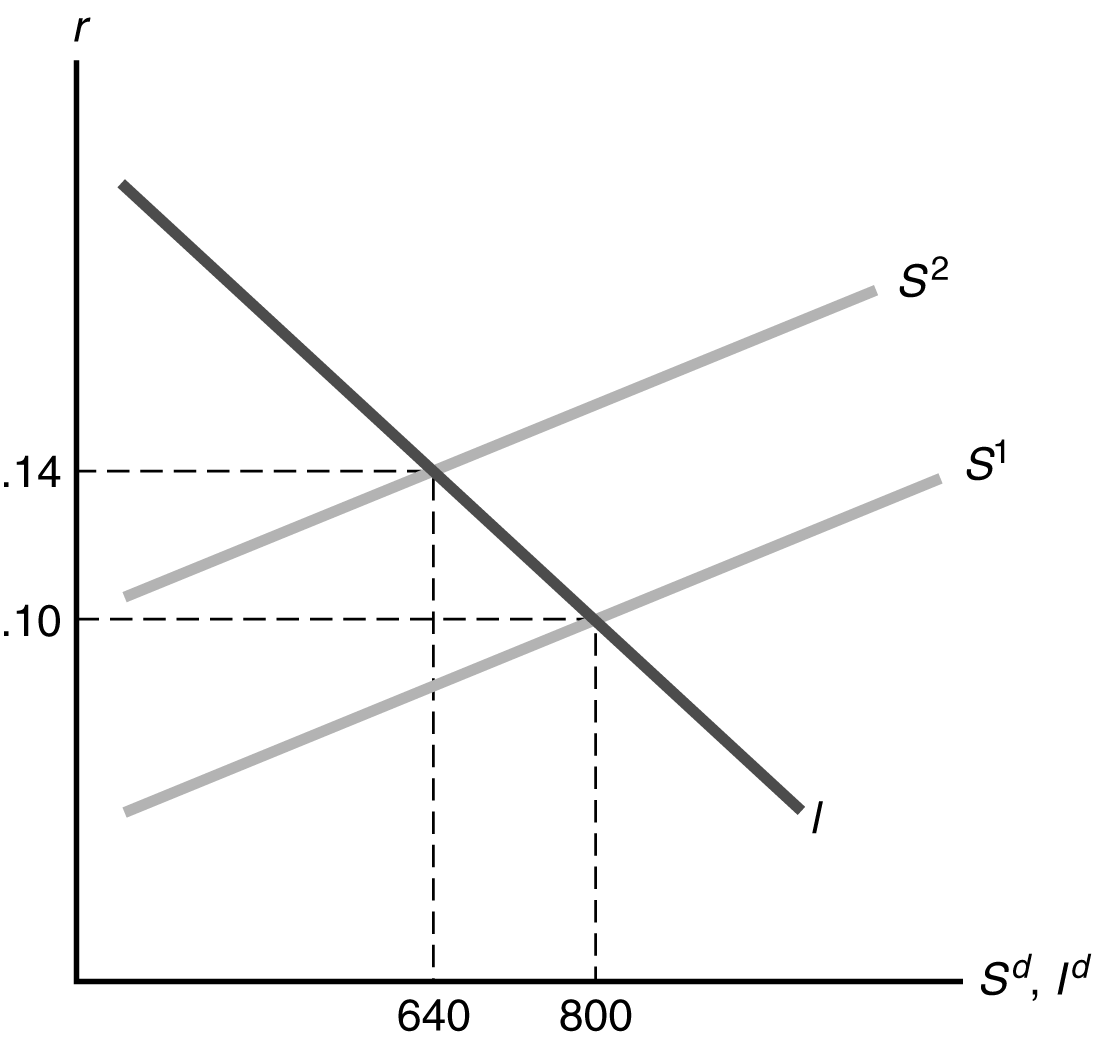
(c) When G
Setting Sd
Id, we get:–5040
6000r
0.9Y 6240At Y 6000, this is 6000r 6240 – (0.9 ´ 6000) 840, so r 0.14. The market-clearing real interest rate increases from 10% to 14%.
7. (a) r 0.10
uc/(1 – τ) (r d)pK/(1 – ) [(.1 .2) ´ 1]/(1 – .5) 0.6.
MPKf uc/(1 – ), so 20 – .02Kf .6; solving this gives Kf 970.
Since Kf – K I – dK, I Kf – K dK 970 – 900 (.2 ´ 900) 250.
(b) i. Solving for this in general:
uc/(1 –
) (r d)pK/(1 – τ) [(r .2) ´ 1]/(1 – .5) .4 2r.MPKf
uc/(1 – ), so 20 – .02K .4 2r; solving this gives Kf 980 – 100r.I
Kf – K dK 980 – 100r – 900 (.2 ´ 900) 260 – 100r.ii. Y
C I G1000
[100 (.5 ´ 1000) – 200r] (260 – 100r)
2001000
1060 – 300r, so 300r 60r
0.2C
560; I 240 S;uc/(1 –
) .4 (2 ´ .2) 0.8;Kf
9601. (a) As Figure 4.5 shows, the shift to the right in the saving curve from S1 to S2 causes saving and investment to increase and the real interest rate to decrease.
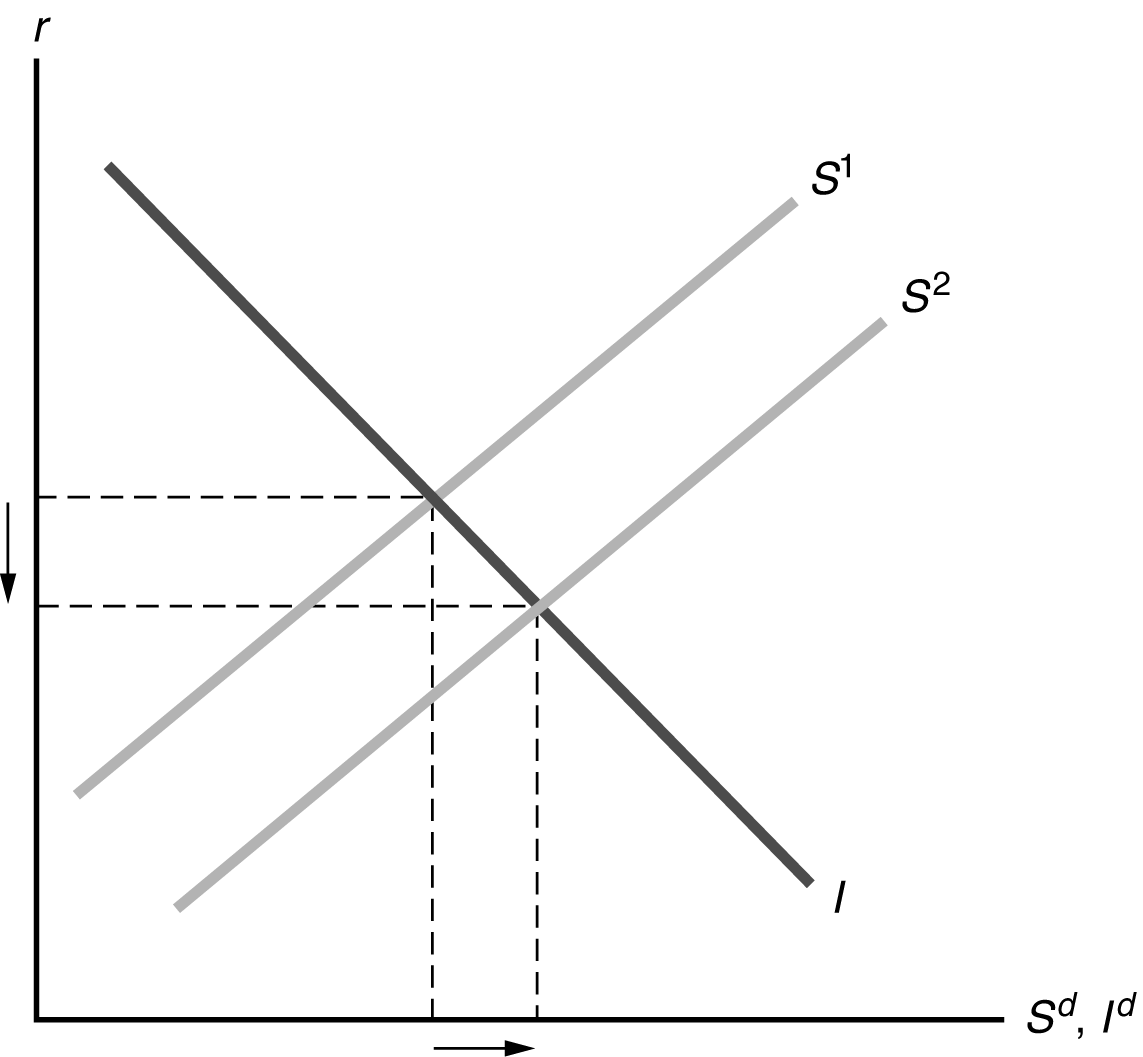
Figure 4.5
(b) This is really just a transfer from the general population to veterans. The effect on saving depends on whether the marginal propensity to consume (MPC) of veterans differs from that of the general population. If there is no difference in MPCs, there will be no shift of the saving curve; neither investment nor the real interest rate is affected. If the MPC of veterans is higher than the MPC of the general population, then desired national saving declines and the saving curve shifts to the left; the real interest rate rises and investment declines. If the MPC of veterans is lower than that of the general population, the saving curve shifts to the right; the real interest rate declines and investment rises.
(c) The investment tax credit encourages investment, shifting the investment curve from I1 to I2 in Figure 4.6. Saving and investment increase, as does the real interest rate.
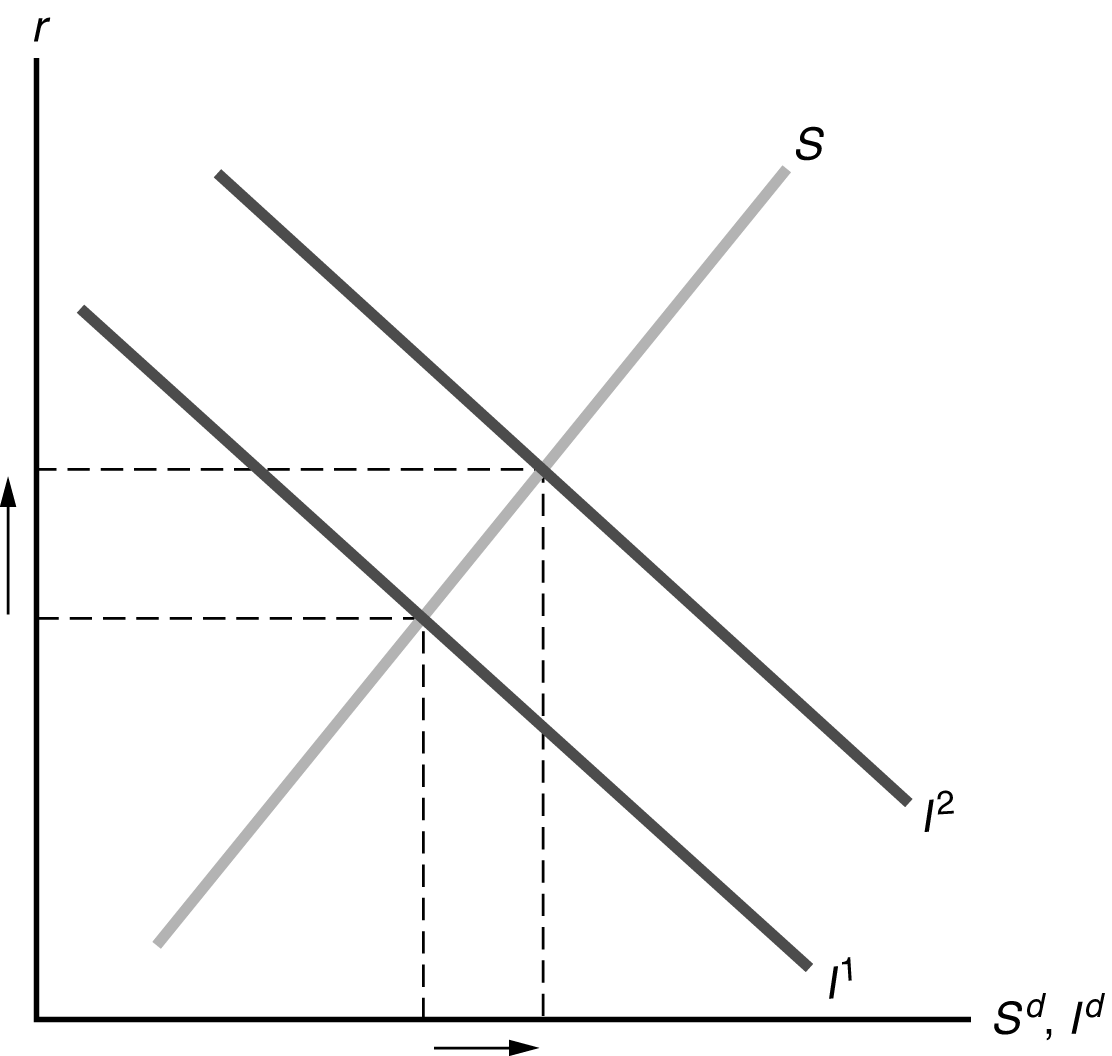
Figure 4.6
(d) The increase in expected future income decreases current desired saving, as people increase desired consumption immediately. The rise of the future marginal productivity of capital shifts the investment curve to the right. The result, as shown in Figure 4.7, is that the real interest rate rises, with ambiguous effects on saving and investment.
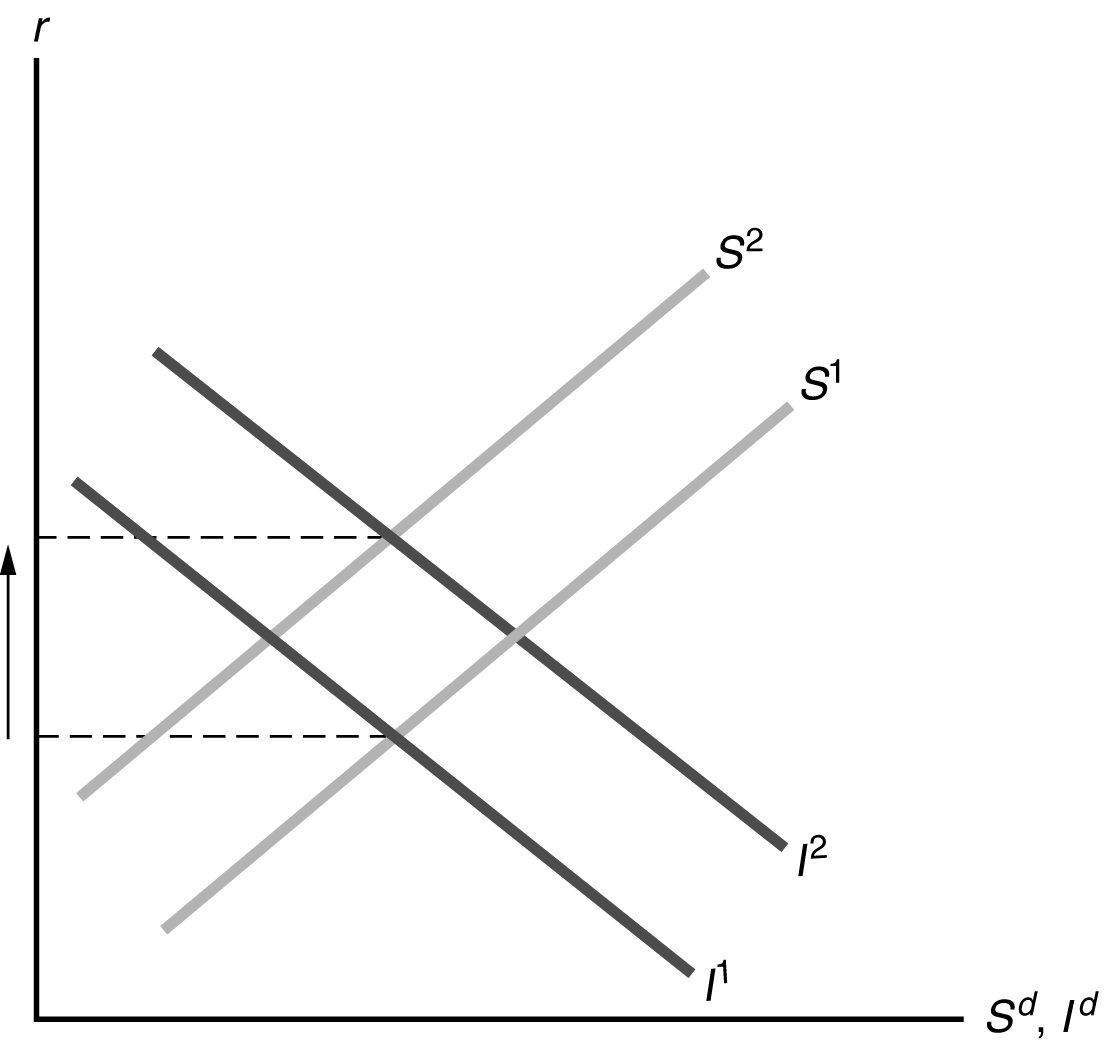
Figure 4.7
2. (a) With a lower capital stock, the marginal product of labor is reduced, so the labor demand curve shifts to the left from ND1 to ND2 in Figure 4.8. Then the new equilibrium point is one with lower employment and a lower real wage. With lower employment and a lower capital stock, full-employment output will be lower.
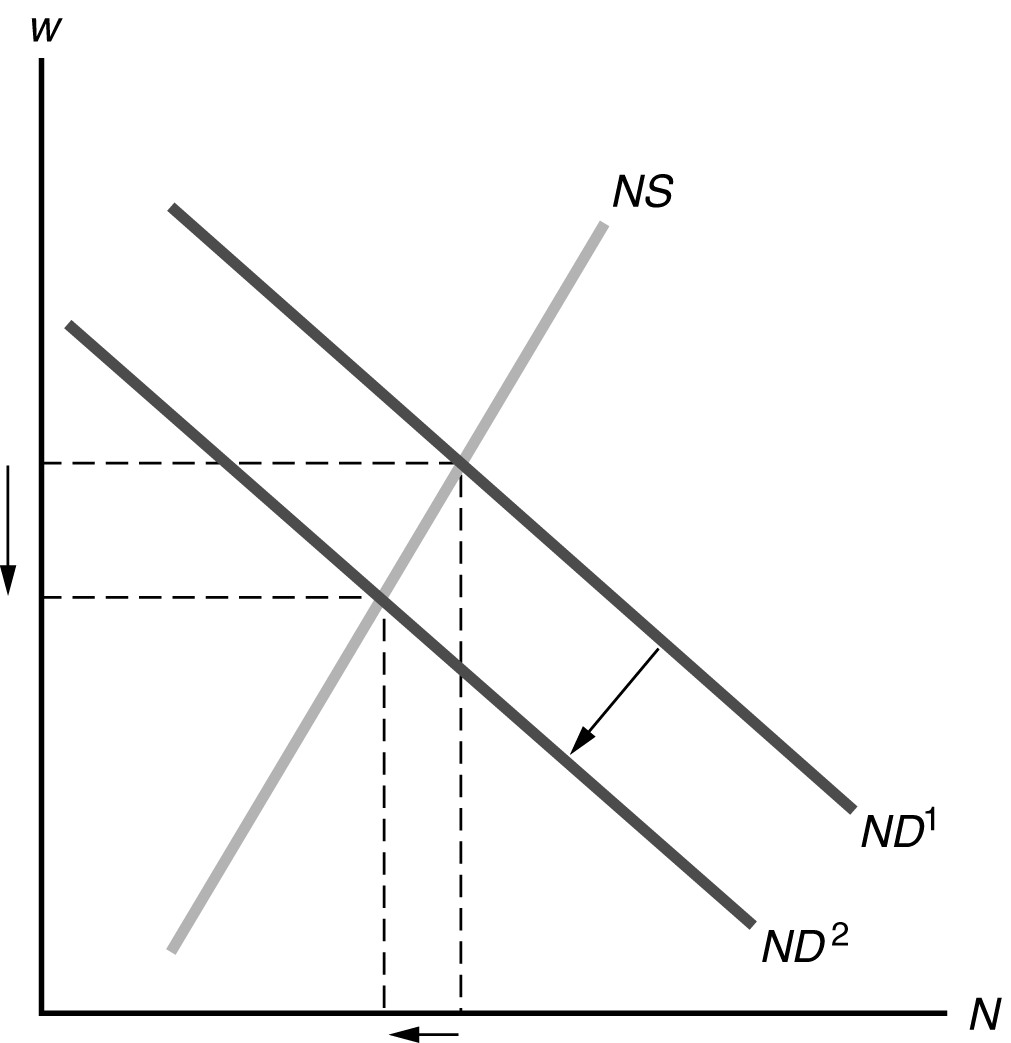
Figure 4.8
(b) Because the capital stock is lower, the marginal product of capital will be higher, so desired investment will increase.
(c) Since current output declines, desired saving declines, because people do not want to reduce their consumption. On the other hand, since future output is also lower, people desire to save more today to make up for the loss of future income.
(d) The increase in desired investment shows up as a shift to the right in the Id curve, from I1 to I2 in Figure 4.9. Then the new equilibrium (assuming no change in desired saving) is at a higher level of investment and a higher real interest rate.
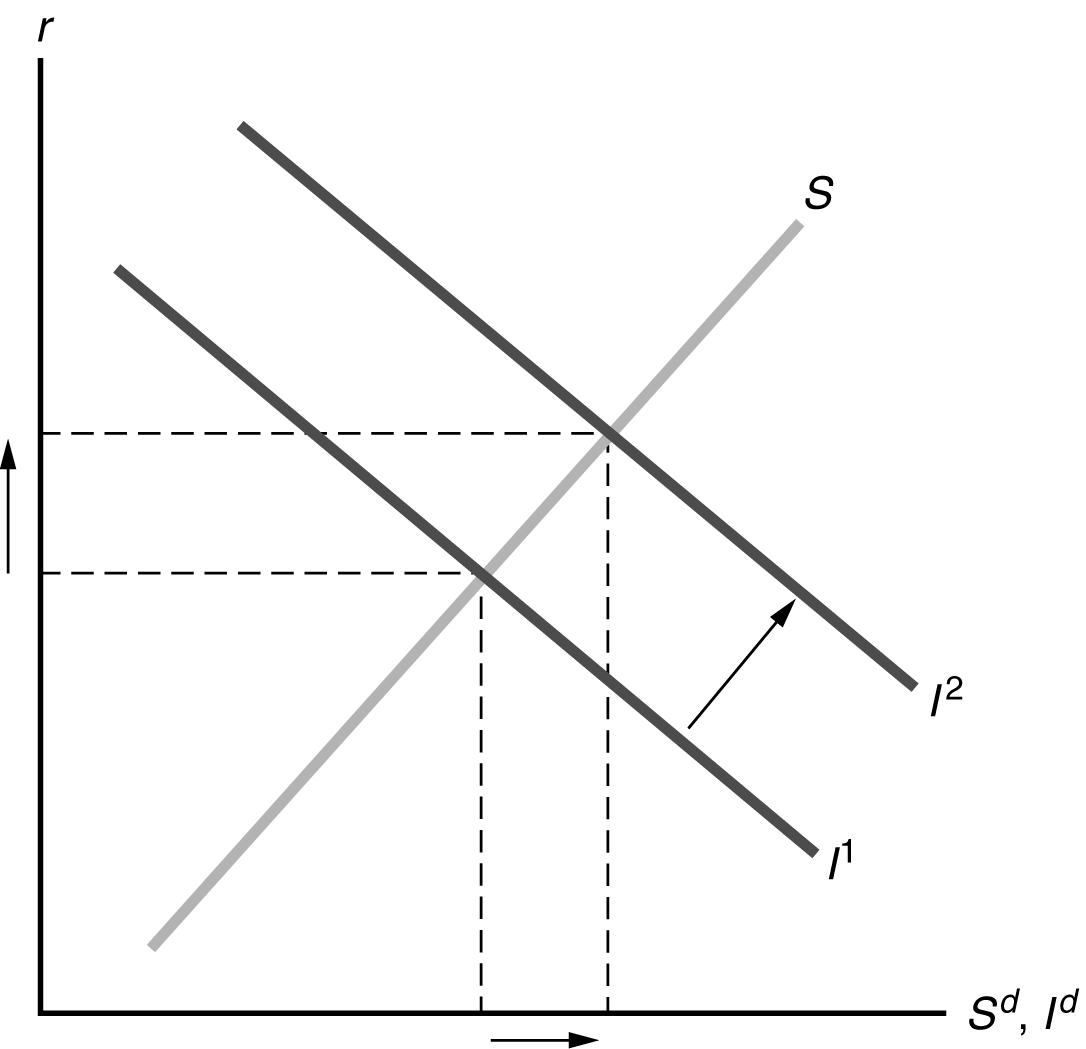
Figure 4.9