1. Let us explore
the Cobb-Douglas production function introduced in class.
Although not explicitly stated, the growth equation listed in 6.1—The
Sources of Growth is this Cobb-Douglas format.
Let us look at an economy over twenty years.
Its total output has grown from 6,501 to 12,679, its capital stock has
risen from 22,033 to 38,440, and its labor force has increased from .107 to
.143. All measurements are in real
terms. Calculate the contributions
to economic growth of growth in capital, labor, and productivity:
a. Assuming that α= 0.3 and β = 0.7.
b. Assuming that α= 0.5 and β=
0.5.
DA/A = DY/Y - aK DK/K - aN DN/N
This is 49.14% in part a and 40.98% in part b.
2. For a particular economy, the following
capital input K and labor input N were reported in four different
years:
|
K |
N |
Y | K/N | Y/N | |
|
1 |
49.3 |
.154 |
.869 | 320.13 | 5.64 |
|
2 |
50.0 |
.155 |
.877 | 322.58 | 5.66 |
|
3 |
50.6 |
.155 |
.880 | 326.45 | 5.72 |
|
4 |
51.2 |
.156 |
.887 | 328.21 | 5.69 |
|
|
|
|
The production
function in this economy is
Y = K.3N.7
where Y is total output.
a. Find total output, the capital-labor
ratio, and output per worker in each year. Compare year 1 with year 3 and year 2
with year 4. Can this production
function be written in per-worker form?
If so, write algebraically the per-worker form of the production
function.
b. Repeat Part (a) but assume now that the
production function is Y = K.3N.8
|
K |
N |
Y | K/N | Y/N | |
|
1 |
49.3 |
.154 |
.721 | 320.13 | 4.681 |
|
2 |
50.0 |
.155 |
.728 | 322.58 | 4.69 |
|
3 |
50.6 |
.155 |
.739 | 326.45 | 4.71 |
|
4 |
51.2 |
.156 |
.737 | 328.21 | 3.72 |
|
|
|
|
3. An economy has the per-worker
production function
yt = 3k0.5
where is
output per worker and is the capital-labor ratio. The depreciation rate is 0.08,
and the population growth rate is 0.04. Saving is
St = 0.1Yt where is
total national saving and is total output.
a. What are the steady-state values of the
capital-labor ratio, output per worker, and consumption per worker?
sf(k) = (n
+
d)k
0.1
´
3k.5 = (0.08
+ 0.04)k
0.3k.5
= 0.12k
0.3/0.12
= k/k.5
2.5
= k.5
k = 62 = 6.25
y = 3k.5 = 7.5
c = y - (n + d)k = 6.75
The rest of the problem shows the effects of changes in the three
fundamental determinants of long-run living standards.
b. Repeat Part (a) for a saving rate of
0.12 instead of 0.1.
sf(k) = (n
+
d)k
0.12
´
3k.5 = (0.08
+ 0.04)k
3
= k.5
k = 32 = 9
y = 3k.5 = 9
c = y - (n + d)k = 7.92
c. Repeat Part (a) for a population growth
rate of 0.06 (with a saving rate of 0.1).
sf(k) = (n
+
d)k
0.1
´
3k.5 = (0.08
+ 0.06)k
2.1428
= k.5
k = 4.59
y = 6.429
c = y - (n + d)k = 5.786
d. Repeat Part (a) for a production function of yt = 4k0.5
Assume that the
saving rate and population growth rate are at their original values.
sf(k) = (n
+
d)k
0.1
´
4k.5 = (0.08
+ 0.04)k
k = 11.11
y = 13.33
c = y - (n + d)k = 12
4. According to our growth model, how
would each of the following affect output per worker, investment per worker,
consumption per worker, and the capital to labor ratio in the long run (that is,
in the steady state)? Illustrate
with a graph!
a. A
hurricane destroys
a portion of
the nation’s capital stock.
The destruction of some of a country’s capital stock would have no effect on the
final steady state, because there has been no change in s,
f, n, or d. Instead, k is reduced temporarily,
but equilibrium forces eventually drive k to the same steady-state value
as before.
b. Congress
decides to allow anyone to migrate to the United States.
As most of the new population has a higher birth rate compared to the
current population, the overall population growth rate
increases.
Immigration raises n from n1 to n2 .
The rise in n lowers steady-state k,
leading to a lower steady-state consumption per worker.
c. Congress
requires all states increase the use non-fossil fuel energy to help protect the
environment. This causes an increase
in
energy prices.
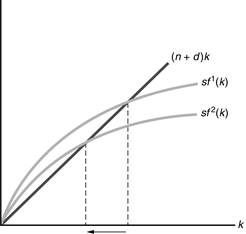
The rise in energy prices reduces the productivity of capital per worker. This causes both the per-capital production function and sf(k) to shift down. The graph below only illustrates the per-capita investment shift to show the decline in steady-state k. All factors will be reduced. When you graph this be sure to include the shift of both curves. I did not have a beautiful pre-made graph so I substituted with this partial , but neat, graph.
d. Americans become increasing anxious
about global warming and increase their saving (a rise in the saving rate) to
provide some protection from future problems.
The changes will look like the graph above, but will not have a change in the per-capita production function. We know that k and y will increase, but c is dependent upon the golden rule.
e. Psychologists
argue that children need greater parental support to have a well-adjusted
childhood. This cause a large number
of two-income families to switch to a single-income family with a stay-at-home
parent. This will cause a permanent decrease in the fraction of
the population in the labor force (the population growth rate is unchanged).
The increase in the size of the labor force does not affect the growth rate of
the labor force, so there is no impact on the steady-state capital-labor ratio
or on consumption per worker. However, our model has limitations.
5. An economy has a per-capita production
function y = Akαh1-α, where A and a are
fixed parameters, y is per-worker output, k is the capital-labor
ratio, and h is human capital per worker, a measure of the skills and
raining of the average worker. The production function implies that, for a given
capital-labor ratio, increases in average human capital raise output per worker.
The economy’s saving rate is s, and all saving is used to
create physical capital, which depreciates at rate d. Workers acquire
skills on the job by working with capital; the more capital with which they have
to work, the more skills they acquire.
We capture this idea by assuming that human capital per worker is always
proportional to the amount of physical capital per worker, or h = Bk,
where B is a fixed parameter.
Find the long-run growth rates of physical capital, human
capital, and output in the economy.
Assume there are a constant number of workers, N, so that Ny
=
Y and Nk = K. Since
y = Akah1–a
and
h =
Bk, then y
=
Aka(Bk)1–a
= (AB1–a)k.
Then Y = Ny
= (AB1–a)K
=
XK, where X equals AB1–a. This puts the
production function in notation used in the chapter.
Investment is DK
+ dK
= sY = national
saving. Dividing through both sides of that expression by K and using the
production function gives DK/K
+ d = sXK/K
= sX, so DK/K
= sX
- d,
which is the long-run growth rate of physical capital. Since output and
human capital are proportional to physical capital, they will all grow at that
same rate.